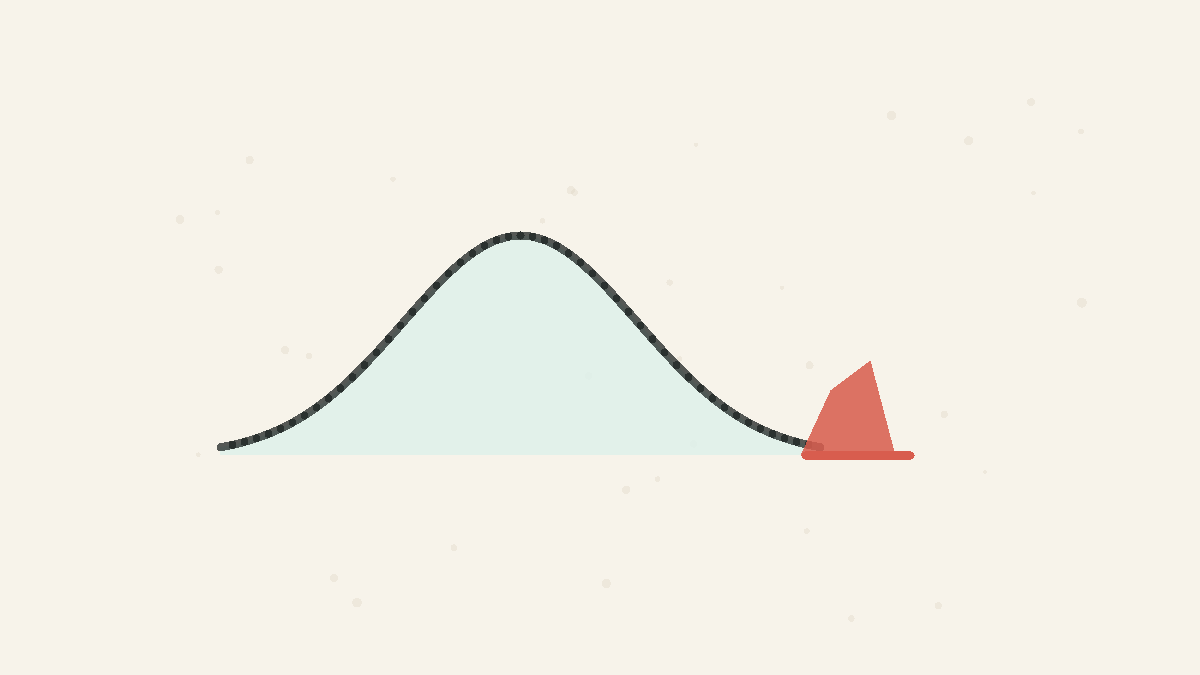
Fact
A p-value is not the chance your result is wrong
A p-value is a check for surprise: it asks how often a result this extreme would appear if there were really no effect. It does not tell you the chance your result is wrong.
A p-value tells you how unusual the data would be under a chosen starting assumption—often 'no effect.' It does not tell you whether a claim is true or how large the effect is.
By the Math Says Yes editorial team
Human-reviewed under our source and correction standards.
How we review content
THE TRAP
A small number looks like a direct score for whether a claim is true. It is not: the calculation starts with an assumption and checks how surprising the data would be.
What the p-value says
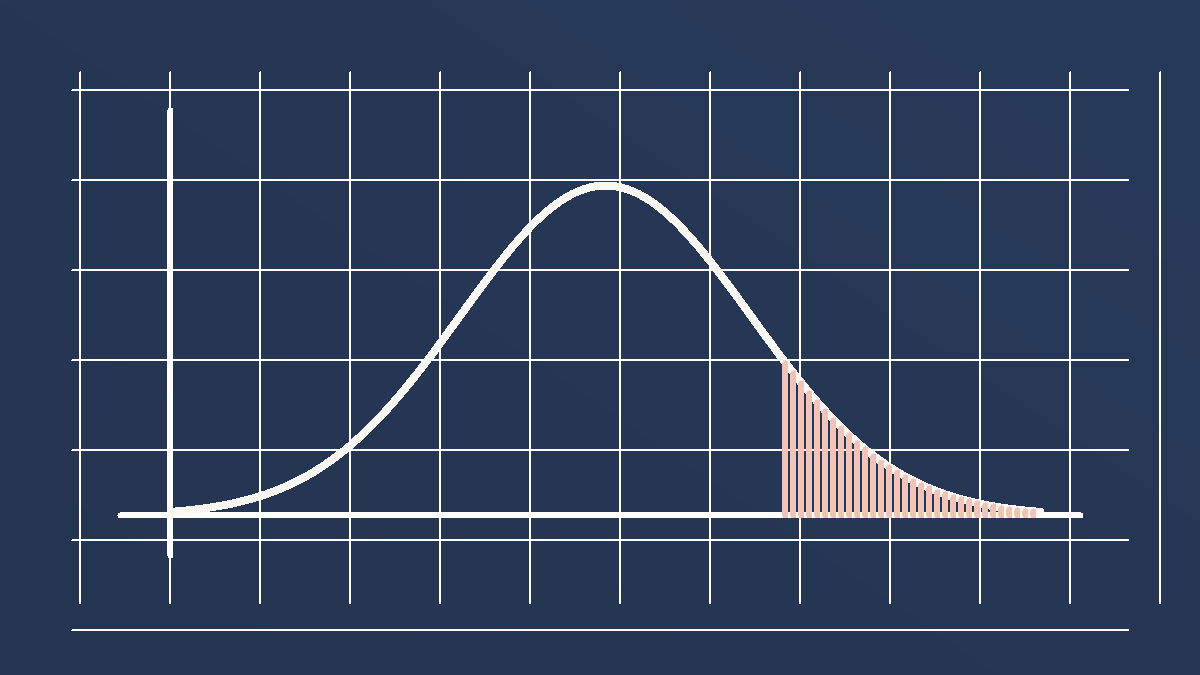
Start with an everyday example. A coin lands heads 60 times in 100 flips. A answers one narrow question: if the coin were fair, how often would 60 or more heads happen? About 2.8% of the time. The smaller that number, the more surprising the result is under the 'fair coin' assumption. In studies, the starting assumption is usually 'no difference' or 'no effect.' Statisticians call it the null model.
What the Numbers Show
about 3 runs with 60 or more heads
about 97 runs with fewer than 60 heads
Out of 100 batches of 100 fair coin flips, about 3 produce 60 or more heads.
What it does not say
The is not the the is true. It is not the chance the result happened by pure luck. It is not the probability the research claim is false. It is also not a measure of the effect's size. A tiny p-value can come from a huge detecting a tiny difference, while a real but noisy effect can produce a large p-value in a small study.
Why it feels like proof
Small numbers feel decisive. A result labeled p < 0.05 also gets a special word, , which sounds like important or proven. The brain then swaps the direction of the question: instead of asking how surprising the data are if the null model were true, it asks how likely the null model is after seeing the data. That second question needs context the does not contain.
How to use it
Read the beside the , , study design, , and number of tests tried. Ask whether the hypothesis was planned before the data were examined and whether independent studies see the same pattern. A small p-value can be useful evidence against a null model. It becomes misleading only when it is promoted from one clue into a verdict.
Worked example
Imagine a fair-coin model predicts about 50 heads in 100 flips, and you observe 62. A asks how often the fair-coin model would generate a result at least that unusual under the test definition. It does not ask whether the coin is fair after seeing the data. That second question needs expectations, possible alternative models, and the cost of being wrong.
When it applies
P-values are useful when the null model is specified before looking at the data and the study design makes the test meaningful. Be much more cautious when many hypotheses were tried, when the cutoff was chosen after seeing the results, or when in sampling or measurement could explain the pattern. A can flag tension between data and model; it cannot rescue a vague question or a biased .
What people get wrong
People often translate p = 0.03 into "there is a 97% the result is real." That reverses the conditional. The starts by assuming a model and then measures how surprising the data would be under that model. It does not update the probability of the model itself.
Source note
The American Statistical Association statement by Wasserstein and Lazar supports the main caution on this page: a is not the that a hypothesis is true, not the probability that the result is random noise, and not a substitute for , design quality, or scientific judgment. The encyclopedia source is used as background for the basic definition.
FAQ
What is a p-value in plain English?
It is the probability of seeing data at least this extreme if the tested null model were true. It measures how surprising the data are under that model.
Why is p = 0.05 not a proof threshold?
Because the cutoff is a convention, not a law of nature. Results just below and just above 0.05 can be practically similar, and both need context about design, effect size, and replication.
Quick Check
A study reports p = 0.03. Which plain-language translation is correct?
A
There is a 97% chance the study's claim is true.
B
The effect is large enough to matter in practice.
C
Results at least this unusual would occur about 3% of the time if there were really no effect.
Sources
The ASA's Statement on p-Values: Context, Process, and Purpose
Authoritative source
The American Statistician · Accessed 2026-06-20
p-value
Secondary explainer
Wikipedia · Accessed 2026-06-16
Know someone who'd like this?
Read next

A one-in-a-million match is not a one-in-a-million chance of innocence
When a forensic trait matches 1 in a million people, a big enough population still holds many innocent matches — the match probability is not the probability of innocence.
Concepts
Conditional Probability
The probability of something after new information changes what is still possible. The important move is to update the denominator: cases ruled out by the new information should no longer be counted. Many mistakes happen when people keep using the original odds after the situation has narrowed.
P-Values
A p-value is the probability of seeing data at least this extreme if a specific null model were true. It is not the probability that the claim is false, not the chance the result was random, and not a measure of how large or important the effect is.