Fact
Randomness clumps more than you think
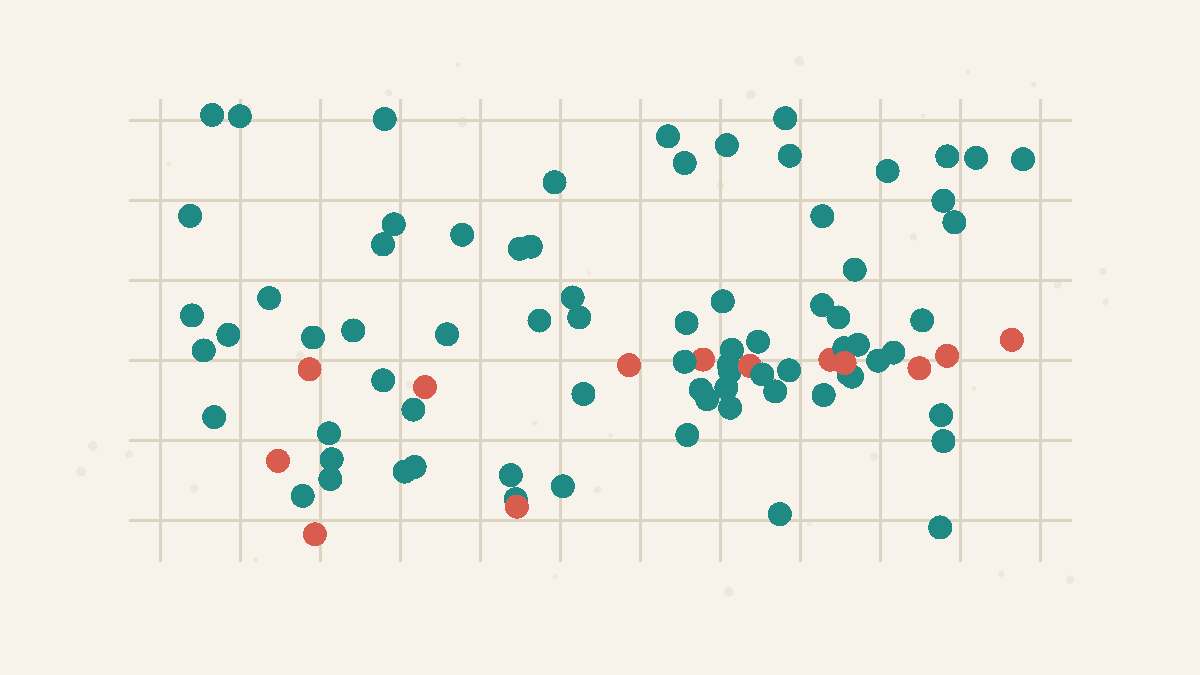
Scatter 100 raindrops across 100 tiles at random and about 37 tiles stay completely dry — while others catch two or three. Real randomness clusters.
We picture 'random' as an even, tidy spread, so the natural clumps and gaps look like a pattern. Pure chance produces them on its own.
By the Math Says Yes editorial team
Human-reviewed under our source and correction standards.
How we review content
THE TRAP
Because an even spread feels 'fair', clumps look caused — a hot streak, a disease cluster, a rigged shuffle. But spacing things out evenly is the unusual outcome; clustering is what chance does by default.
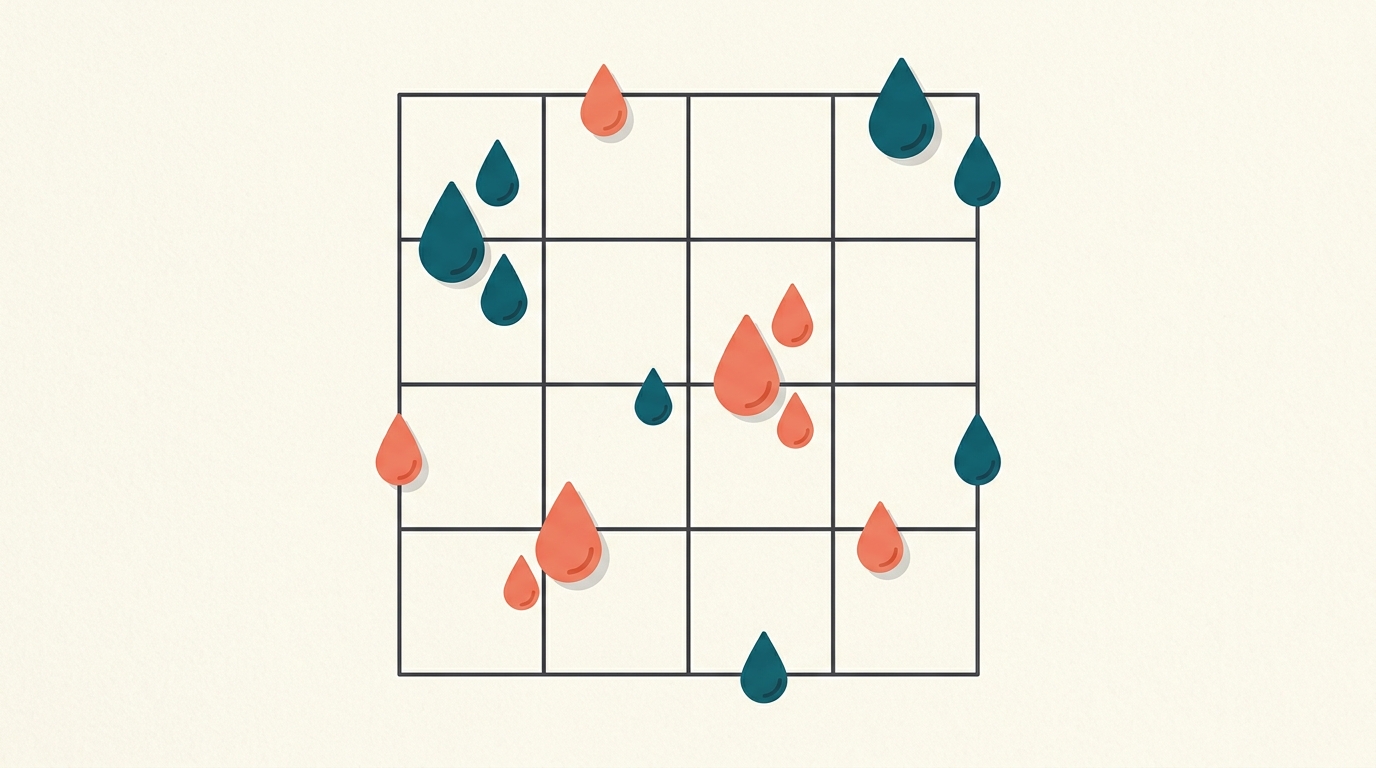
What this shows
Random does not evenly spaced. If events land independently, nothing tells them to avoid a tile that already has an event or to fill a tile that is empty. That means gaps and clumps are not exceptions to randomness; they are a normal output of randomness. The clustering illusion happens when we see those natural bunches and treat them as evidence of a hidden cause before checking what alone predicts.
What the Numbers Show
37%
Empty
37%
Exactly one
26%
Two or more
With 100 random drops on 100 tiles, about 37 stay empty and 26 receive at least 2 drops.
Source: Poisson distribution · The hot hand in basketball: On the misperception of random sequences
Why intuition fails
People often imagine random as deliberately mixed: no long gaps, no repeats, no crowded areas. But that picture is closer to evenly arranged than random. A true random process has no spacing rule, so it naturally creates streaks, dry patches, and hotspots. Our pattern detector then supplies a story: a hot hand, a suspicious neighborhood, a rigged shuffle. Sometimes the story is real, but the first comparison should be against a null model of .
Worked example
Put 100 random raindrops onto 100 equal tiles. The is one drop per tile, but that does not mean every tile gets one. Under a Poisson model with average rate 1, the of an empty tile is e^-1, about 36.8%. The chance of exactly one drop is also about 36.8%. The remaining 26.4% of tiles get two or more drops. So a random 100-tile grid is expected to have roughly 37 empty tiles and 26 clustered tiles. The same math runs in time as in space: flip a fair coin 100 times and streaks of five heads are normal, because there are many chances for a run to start.
How to use it
Before treating a clump as meaningful, build or simulate the null case. If events were independent at the same rate, how many empty spaces, double hits, streaks, or hotspots would you expect? Also count how many places you inspected. Searching many neighborhoods, teams, dates, or grid cells makes at least one impressive-looking cluster much less surprising.
What people get wrong
Five heads in a row, three illness cases on one street, a fund manager's winning streak — the mistake is jumping to either extreme about them. A cluster is not automatically a signal, but it is not automatically meaningless either. The right question is whether it is larger, more persistent, or more targeted than the clusters your random model already predicts. Evidence begins where the observed clump exceeds the ordinary clumpiness of .
When it applies
The clustering illusion appears in sports streaks, disease maps, customer complaints, defects, stock charts, crime locations, and social-media bursts. It matters most when many places or time windows are scanned after the fact. The more opportunities you inspect, the more likely some cluster will look meaningful by .
Source note
Gilovich, Vallone, and Tversky's hot-hand paper is the classic study of misperceiving random sequences. This page uses that idea more broadly: perceived streaks and clusters need to be compared with the amount of clustering randomness itself can produce.
Try It
Random scatter
Drop 100 points into 100 cells and see where they land.
—
empty cells
—
busiest cell
Purely random drops clump naturally. Around 37 cells stay empty every time — clustering is what randomness looks like.
FAQ
Why do about 37 tiles stay empty?
When 100 drops land independently on 100 tiles, the average is one per tile. A Poisson model with average rate 1 gives an empty-tile probability of e^-1, about 36.8%, so about 37 of 100 tiles stay empty.
Does a cluster mean there is no signal?
No. A cluster can be real evidence, but only after comparison with what random variation would already create. The key is whether the cluster is unusual relative to a clear null model.
How do I check a suspicious cluster?
Estimate the expected pattern under randomness, ideally by calculation or simulation. Then account for how many locations or time windows you searched. A cluster found after many looks needs stronger evidence.
Quick Check
If you scatter points completely at random across a grid, the result usually looks…
A
Arranged in a neat grid
B
Perfectly even and regularly spaced
C
Clumpy, with clusters and empty gaps
D
Bunched into a single corner
Sources
Clustering illusion
Secondary explainer
Wikipedia · Accessed 2026-06-14
Poisson distribution
Secondary explainer
Wikipedia · Accessed 2026-06-14
The hot hand in basketball: On the misperception of random sequences
Primary source
Cognitive Psychology · Accessed 2026-06-20
Know someone who'd like this?
Read next

A random number can drag your guess
Spin a wheel to a random number, then ask people to estimate a fact — and those who saw a bigger number guess bigger, even when the number was obviously meaningless.