Fact
How risky is skydiving, really?
A "micromort" is a one-in-a-million chance of dying — and it lets you compare a skydive to a long drive on the same scale.
Putting dangers on one common unit beats ranking them by how scary they feel.
By the Math Says Yes editorial team
Human-reviewed under our source and correction standards.
How we review content
THE TRAP
We rank danger by how vividly we can picture it, so rare dramatic risks feel bigger than common dull ones.
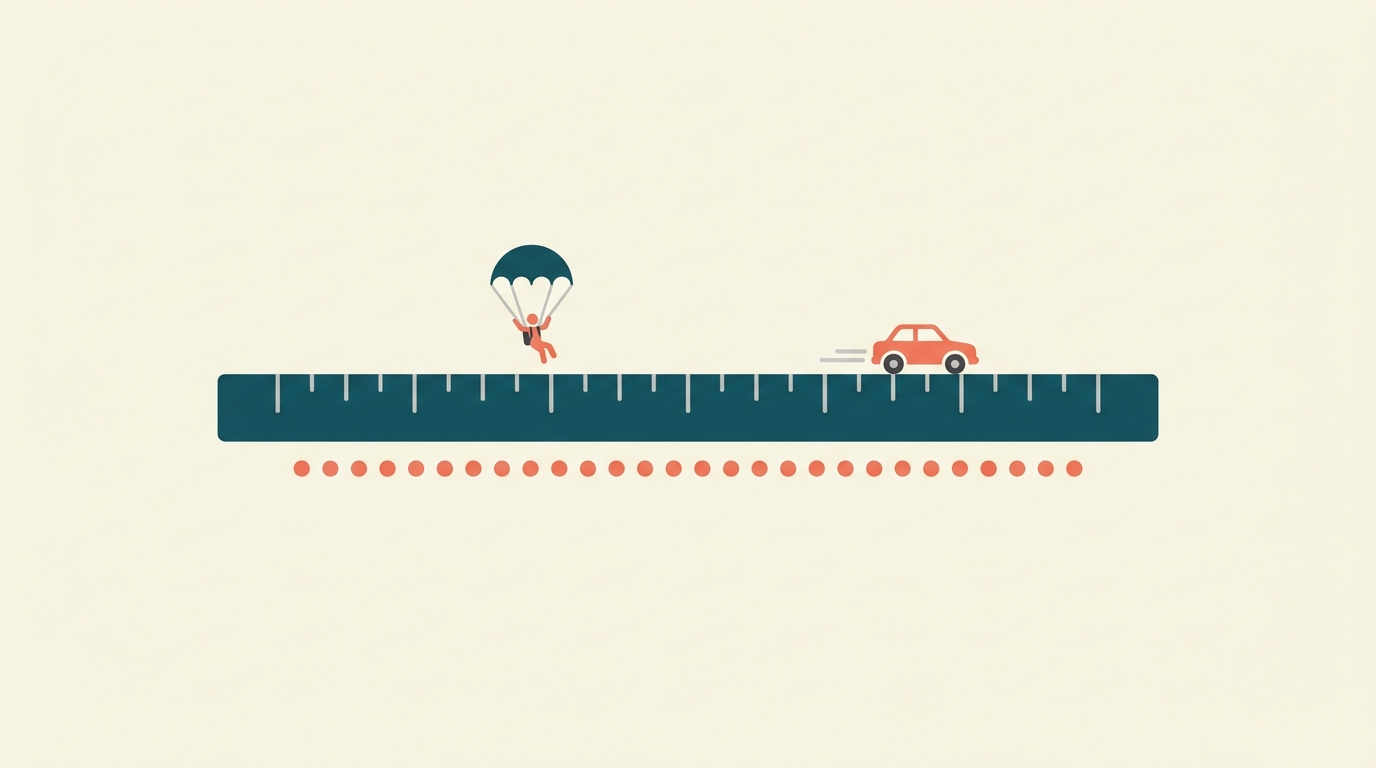
What this shows
A micromort is a one-in-a-million of death. That sounds grim, but it solves a real comparison problem: different activities come with risks that are hard to compare by instinct. The chart keeps the math in the background and translates each value into a frequency: roughly one fatality per some number of drives, dives, jumps, launches, ski days, or ascent attempts.
What the Numbers Show
Plain-English translation
🪂 Skydive
1 death / ~125,000 jumps
8
expected deaths per 1,000,000 jumps
8 micromorts
source estimate for one jump
Bars use a log scale: each big step is much more risk, and the headline translates the selected activity.
Read each bar as repeated attempts of the named activity. Example: 74 micromorts means about 74 expected deaths per 1,000,000 paraglider launches, or roughly 1 death per 13,500 launches.
Each bar translates Wikipedia's micromort estimate into a frequency: about one fatality per N drives, dives, jumps, launches, ski days, or ascent attempts.
Source: Micromort · The Norm Chronicles: Stories and Numbers About Danger and Death
Why intuition fails
Falling through the sky is easy to picture, so it feels larger than routine driving: risk perception is shaped by vividness. Routine risks become background noise because they are familiar and repeated. The micromort does not remove every value judgment: voluntary risks, benefits, control, and who bears the risk still matter. But it does separate size from drama, which is the first step toward a calmer comparison.
Worked example
The Wikipedia micromort page lists about 0.7 micromorts for a day of skiing, 1 for 370 miles of car travel, 5 for a scuba dive, 8 for a skydive, 74 for a paraglider launch, 430 for a BASE jump, and about 2,840 for a Matterhorn ascent attempt. The values are approximate and context-specific, but they read on one scale: a skydive at 8 carries roughly eight times the fatal risk of that 370-mile drive at 1. Turning each value into "one fatality per about N attempts" makes the scale easier to read without changing the underlying numbers.
How to use it
Use micromorts for small, acute risks and keep the exposure unit visible. Ask whether the number is per jump, per dive, per mile, per day, or per year. Then compare like with like. For repeated small exposures, the risks can often be added roughly, but the assumptions matter. Chronic risks that shorten life over years may need a different unit, such as microlives.
What people get wrong
A skydiver reading "8 micromorts" has not learned their personal for tomorrow's jump. The published values are -based approximations from particular contexts, equipment, rules, countries, and time periods, so your own risk may differ. A second misreading is reacting to the word instead of the number — shark, radiation, surgery — and letting the label overrule the shared scale. The value of the unit is comparison, not certainty: it gives a shared ruler, not a guarantee for a specific person on a specific day.
When it applies
Micromorts are useful for comparing small acute fatal risks across activities. They are less useful for chronic harms, quality of life, nonfatal injuries, voluntary versus involuntary risk, or risks that are concentrated in vulnerable groups. Use the unit to get scale, then add context about who is exposed and what kind of harm is being counted.
Source note
The chart uses the micromort values listed on Wikipedia's Micromort page. The Norm Chronicles supplies the broader micromort framing: putting diverse small risks onto a common scale while remembering that one fatal-risk unit cannot capture every value judgment.
FAQ
What is a micromort?
A micromort is a one-in-a-million chance of death. It is a common unit for small acute risks, so very different activities can be compared on the same scale.
Are micromort values exact?
No. They are approximate values estimated from historical data and specific contexts. They are useful for scale comparisons, but they do not predict the exact risk for a particular person, route, instructor, equipment setup, or day.
How should I compare two risks?
Put them on the same unit and the same exposure basis. Compare per trip with per trip, per year with per year, and acute risks with acute risks. Otherwise the numbers can look comparable while measuring different things.
Quick Check
What does one micromort represent?
A
One death per million people per year
B
A one-in-a-million chance of death
C
A one-in-a-thousand chance of injury
D
A million possible causes of death
Sources
Micromort
Secondary explainer
Wikipedia · Accessed 2026-06-14
The Norm Chronicles: Stories and Numbers About Danger and Death
Authoritative source
Basic Books · Accessed 2026-06-20
Know someone who'd like this?
Read next

Relative risk vs absolute risk: the difference that changes decisions
Relative risk tells you how many times bigger a risk became. Absolute risk tells you how many extra people are affected.