Fact
The best performers usually slip next time
A team's top scorers, a test's top students, and a clinic's sickest patients all tend toward the middle on the next measurement with no intervention at all, because the extreme result was part skill and part luck, and the luck rarely repeats.
Before crediting the coach, the medicine, or the pep talk, ask what chance alone would have done: selected extremes drift back toward the average, and only a comparison against an equally extreme untreated group reveals a real effect.
By the Math Says Yes editorial team
Human-reviewed under our source and correction standards.
How we review content
THE TRAP
When a star slips, we reach for a story — pressure, complacency, a jinx, or a cure that wore off. We credit that story for a movement that pure chance already predicts.
What regression to the mean is
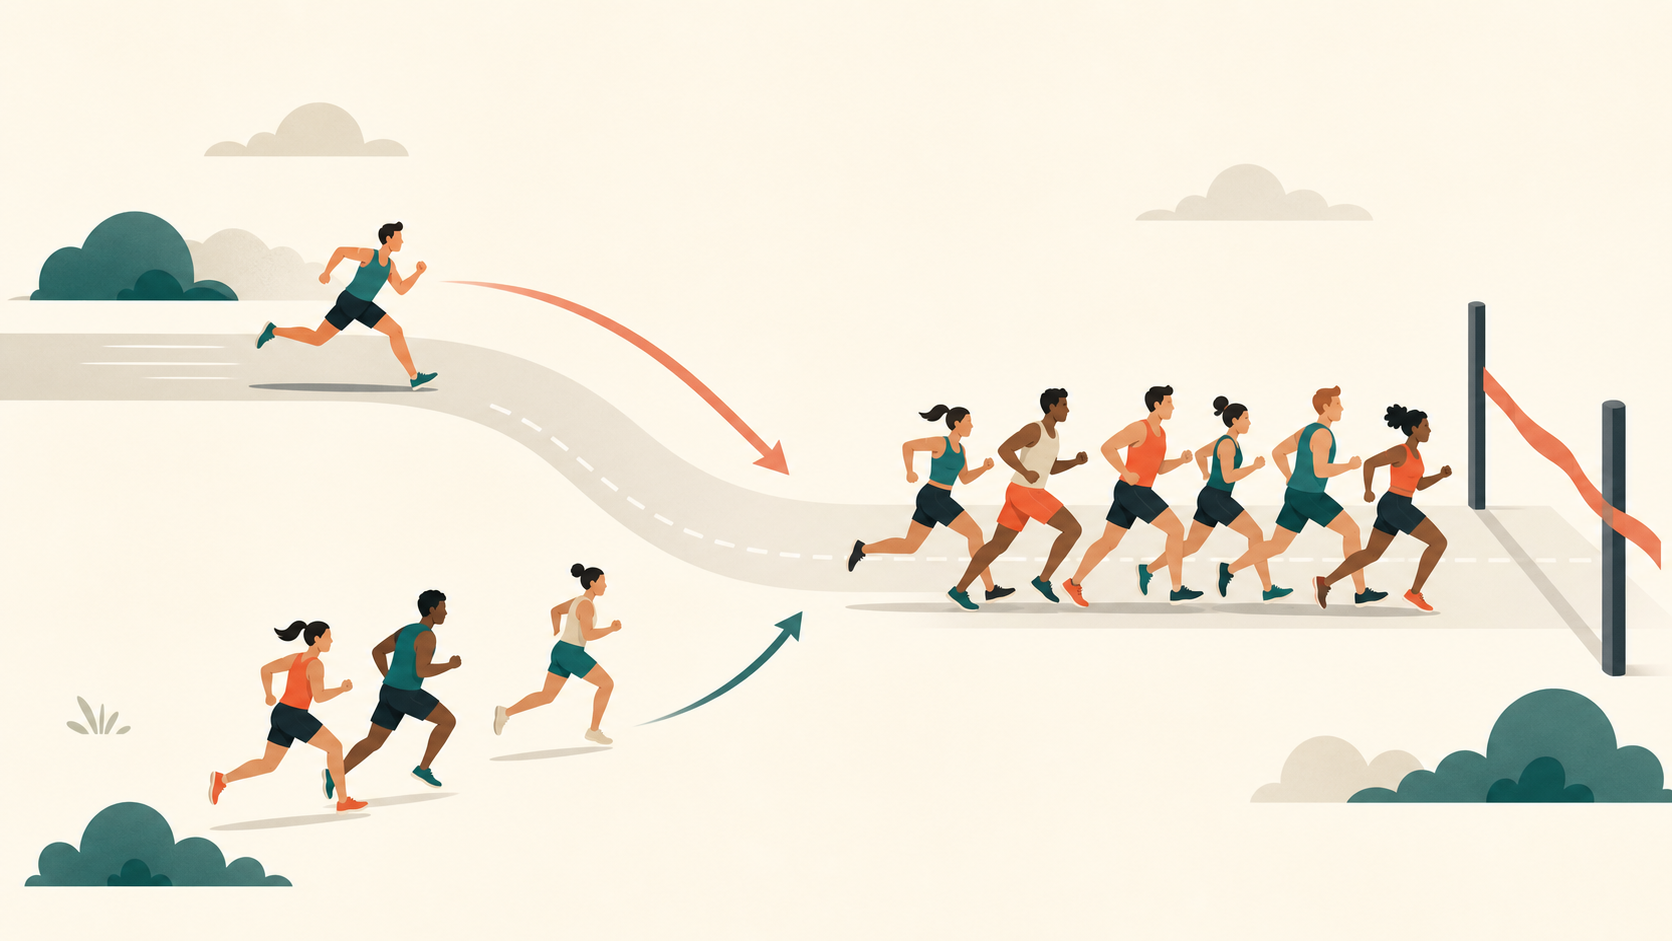
A hot streak in sports, a spike in test scores, an alarmingly high blood-pressure reading — extreme measurements tend to be followed by ones closer to the , and that pull-back is to the mean. The reason is that almost any result combines a stable part, like real skill or a real condition, with a one-off part, like luck, mood, or measurement noise. A reading is extreme partly because both parts happened to push in the same direction at the same time. The stable part stays, but the lucky push usually does not return, so the next reading drifts back toward the average. No cause is needed beyond .
What the Numbers Show
90
Top group · round 1
74
Top group · round 2
30
Bottom group · round 1
46
Bottom group · round 2
Illustrative: groups selected at one extreme drift toward the overall average near 60 on the next measurement.
Why intuition fails
When a top performer dips, our minds want a reason. We say the pressure got to them, success made them lazy, or a streak ran out. Each story is causal and satisfying, and each is unnecessary. The movement toward the is exactly what predicts once you have selected on an extreme. Attaching a cause to it is the error, because the drift would happen with no change in effort, attitude, or circumstance at all.
Worked example
Rank people on a single round of a test where the score mixes ability and luck — a good night's sleep, a few lucky guesses. Take the top ten finishers and run the round again under identical conditions. Their score falls, not because anyone got worse, but because their first-round scores included a lucky bump that did not repeat. The effect is symmetric: the bottom ten of the first round rise on the re-run, because their unlucky dip did not repeat either. Both groups move toward the overall average.
How to use it
Whenever you select something for being at an extreme, expect it to drift toward the on the next look. That single habit defuses a lot of false stories. When you want to judge whether an intervention actually worked, do not compare the after with the extreme before. Compare the treated group against a that started just as extreme but got no treatment. Only the gap between those two groups isolates a real effect from the drift that was coming anyway.
What people get wrong
The classic trap is the "treatment worked" story. Select the worst cases — the sickest patients, the lowest-scoring students, the weakest sales region — apply something, and watch most of them improve. The improvement looks like proof, but it is exactly what predicts even if the treatment did nothing, because the worst cases were partly unlucky and many would have rebounded on their own. Praise, punishment, coaching, and reorganizations all get credited or blamed the same way. Without a selected the same way, you cannot tell a working treatment from ordinary regression toward the .
When it applies
to the appears when measurements contain random variation and you focus on unusually high or low cases: sports streaks, test scores, medical readings, sales numbers, fund returns, or customer complaints. It is strongest when selection is based on an . Compare against a before crediting an intervention.
Source note
The historical anchor here is Galton's 1886 paper on toward mediocrity. The page uses the same statistical idea in everyday settings: when an observed value is partly signal and partly noise, extreme observations tend to be followed by less extreme ones.
Try It
Regression to the mean
Pick the top performers, then run the round again.
75
top 10 · round 1
61
top 10 · round 2
luck in the score: 60%
The top group almost always scores lower the second time. Nobody got worse — the lucky part of their first score just didn't repeat.
FAQ
Why do the best performers usually decline?
Their standout result combined real ability with a dose of good luck that happened to land at the same time. The ability stays, but that lucky bump rarely repeats, so the next result settles closer to their true level. They did not get worse; the exaggeration in the first reading simply faded.
Does regression to the mean mean everyone becomes average?
No. The overall spread of the population stays the same from one round to the next, so there are always extremes. It is the specific cases you selected for being extreme that drift back, because you partly selected on luck. The population does not collapse toward the middle; only the lucky outliers you picked do.
Quick Check
A clinic treats its sickest patients and most improve. Why is that weak evidence the treatment works?
A
Sick patients always recover on their own eventually.
B
Many were at an unlucky low point and would improve anyway.
C
The treatment must have worked because they improved.
Sources
Regression toward the mean
Secondary explainer
Wikipedia · Accessed 2026-06-15
Regression towards mediocrity in hereditary stature
Primary source
The Journal of the Anthropological Institute of Great Britain and Ireland · Accessed 2026-06-20
Know someone who'd like this?
Read next
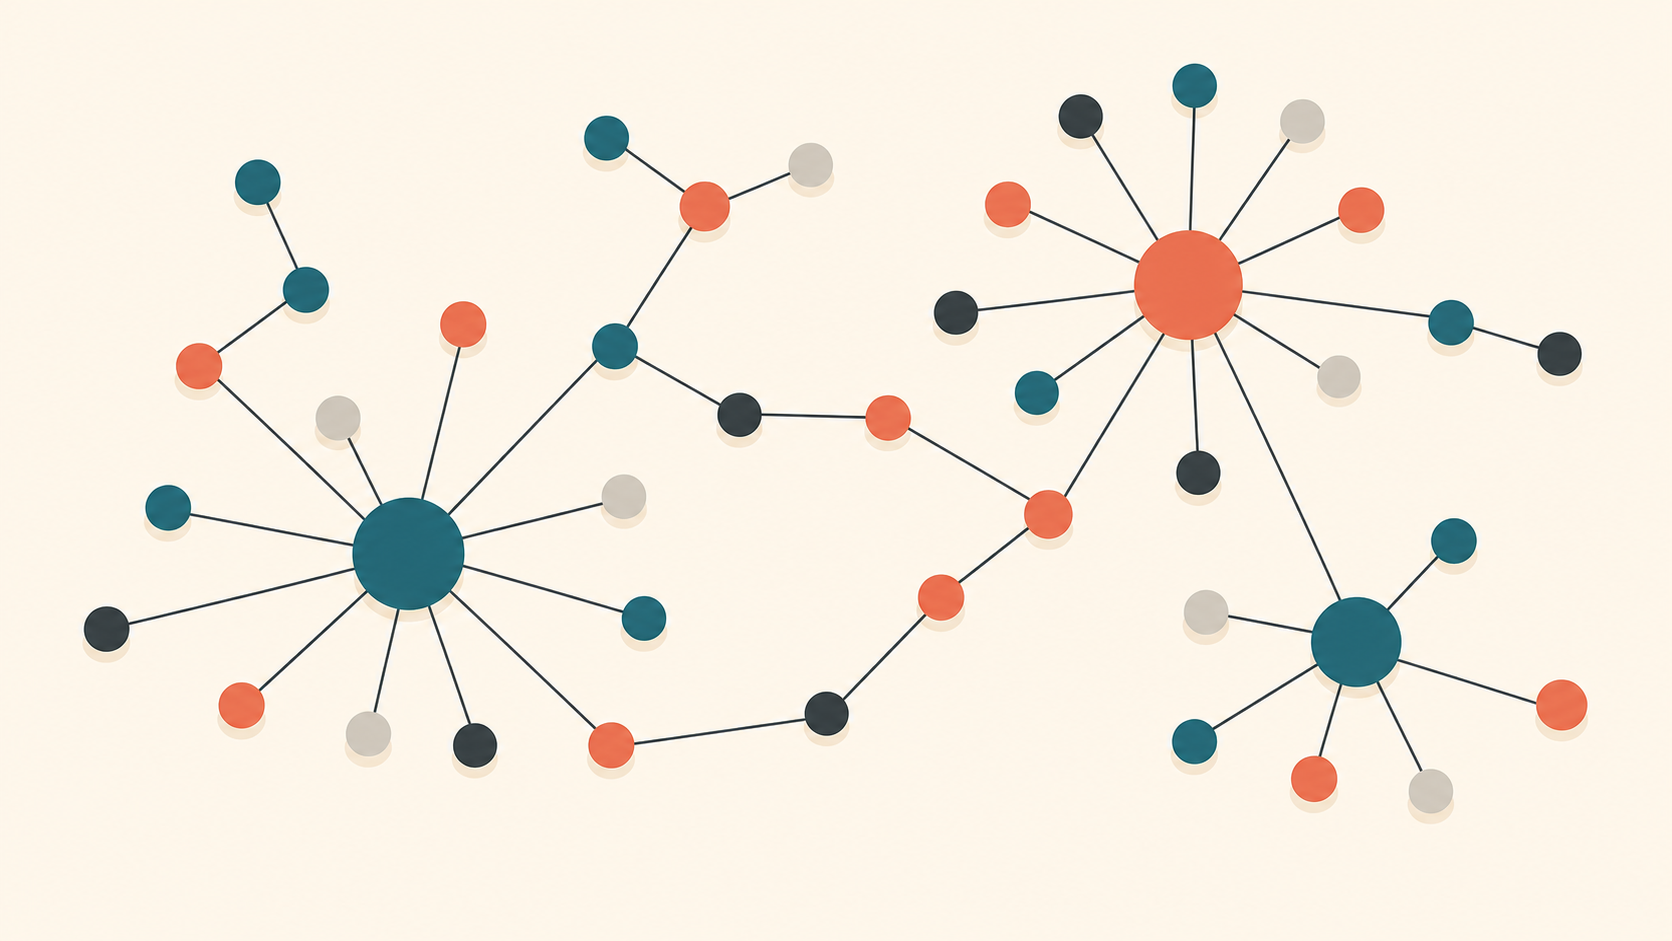
Why your friends seem more popular
Pool every name occurrence from every friend list and well-connected people appear more often. The resulting average is never below the uniformly random-person average, and is higher when friend counts vary.