Lesson
Small Samples Are Noisy
A small sample can land far from the truth by luck alone, while a larger one averages that luck away. This lesson shows how spread shrinks with the square root of the sample size and why the smallest groups dominate the extremes of any ranking.
By the Math Says Yes editorial team
Human-reviewed under our source and correction standards.
How we review content
Signal and sample size
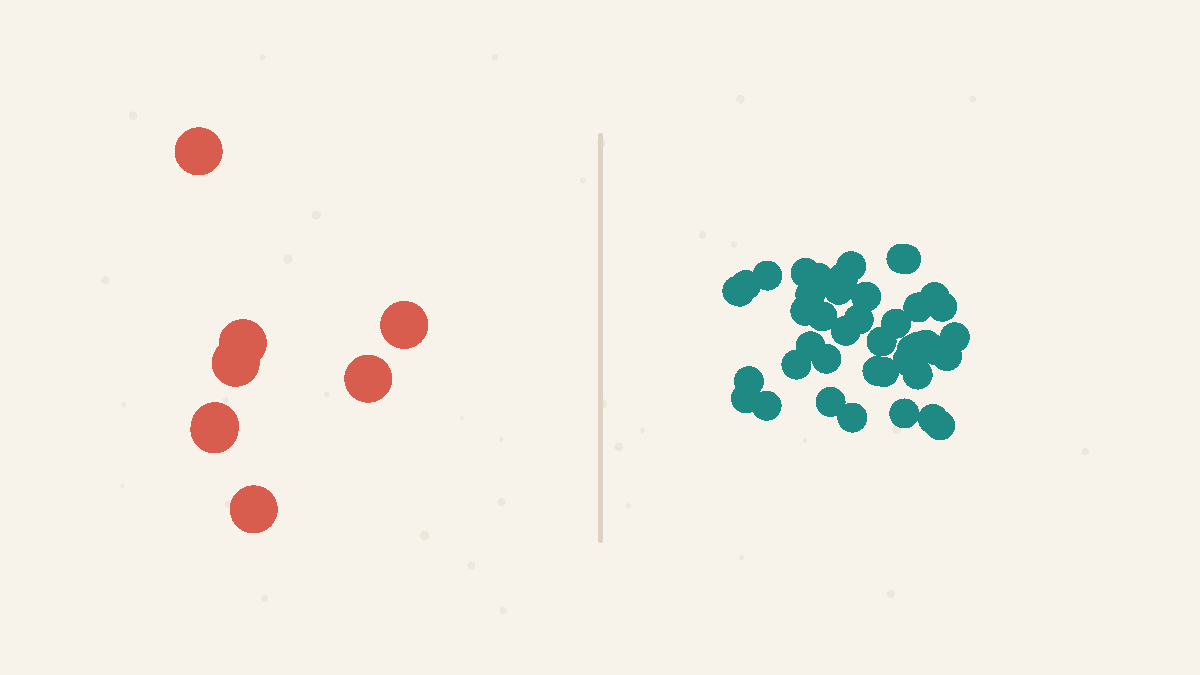
Any measured rate is a mix of the real underlying value and random noise. With only a few observations, the noise has a loud voice: a single unusual case can swing the result far from the truth. As you add more observations, the lucky highs and unlucky lows start to cancel out, and the settles closer to the real value. This is the in everyday form. A bigger is not just a little more reliable; it actively averages away the luck that dominates a small one, which is why you should trust a rate built on thousands far more than the same rate built on a dozen.
The square-root rule
The swing of a does not shrink in step with the ; it shrinks with the square root of it. Roughly, the typical distance from the truth scales like one over the square root of n. That has a blunt practical meaning: to cut the swing in half, you do not need twice the data, you need four times as much. To cut it to a third, you need nine times as much. This is why early data is so jumpy and why the first hundred responses to a survey wobble far more than the next thousand. Each new observation helps, but with diminishing returns, so precision is expensive and small samples stay stubbornly noisy.
Ranking small units
Whenever you rank places, schools, hospitals, or teams by a rate, the extremes of the list tend to be the smallest units, not the special ones. A village of two hundred people can post the highest or the lowest disease rate in a country in the same year, simply because one or two cases move its rate enormously. A big city can never swing that far, because its huge denominator pins it close to the . So a top-and-bottom ranking of rates often becomes a ranking of who is smallest, dressed up as a ranking of who is best or worst. The pattern is so reliable that seeing tiny units at both ends is a clue the differences are mostly noise.
The habit
The fix is a small habit: read the denominator before you react to the rate. Whenever a percentage, a per-capita figure, or a ranking lands in front of you, ask how many cases and how many people it is based on. A startling rate built on five cases deserves a shrug, not a headline. When you compare units of very different sizes, it helps to shrink the noisiest small- rates toward the overall before ranking them, which keeps tiny groups from hijacking both ends of the list. The number on top is the rate, but the number underneath is the one that tells you whether to believe it.
FAQ
How does sample size affect the spread of a rate?
With few observations, a single unusual case moves the rate a long way, so a small sample can land far above or far below the true value by chance alone. Large samples absorb those individual cases, so their rates stay close to the truth and rarely reach the extremes.
Why does collecting more data make a rate more trustworthy?
It says that as you collect more observations, the average of your sample gets steadily closer to the true average and the random swings shrink. The bigger the sample, the more luck cancels out, which is why a rate from thousands of cases is far more trustworthy than the same rate from a handful.
Try the idea
Small samples swing wild
Draw several samples of fair coin flips and watch the spread.
60 pts
spread of heads-rate
flips per sample: 10
With 10 flips per sample, the twelve draws spread across 60 percentage points. Small samples wander far from 50% on luck alone; add flips and that spread collapses toward zero.
Quick Check
Why do the smallest towns often appear at BOTH the top and bottom of a 'rate per 100,000' ranking?
A
Tiny populations swing far from the true rate by chance.
B
Small towns are genuinely healthier and sicker than big cities.
C
Rates per 100,000 only work for big cities.