Fact
The smallest towns top both the best and worst lists
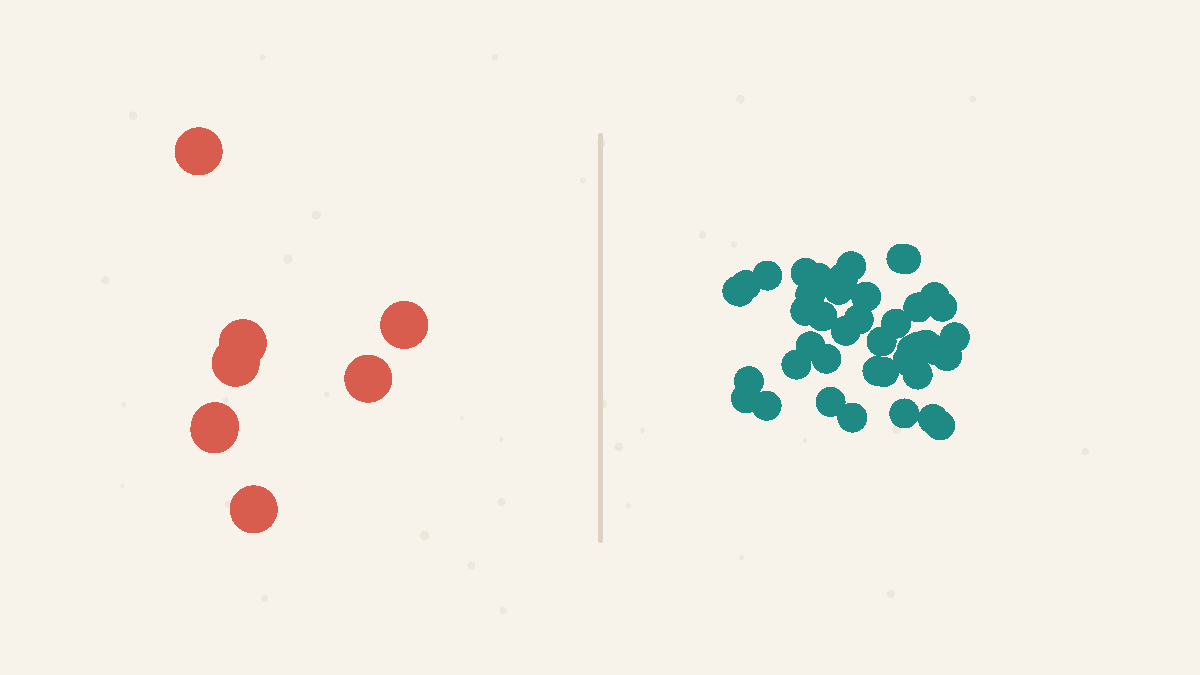
Rank places by any rate — cancer, test scores, crime — and the extremes are dominated by the smallest places, because small samples swing far from the true rate by luck alone.
The law of large numbers names the effect: measured rates scatter around the truth, and the scatter shrinks only as samples grow — so check the denominator before believing any extreme rate.
By the Math Says Yes editorial team
Human-reviewed under our source and correction standards.
How we review content
THE TRAP
We read an extreme rate as a strong signal and ignore the denominator — how few people it is based on. A startling number from a tiny group feels just as convincing as the same number from a huge one.

What this shows
Any rate you measure is a , and a sample scatters around the true rate by an amount that shrinks as you add data. Roughly, the typical distance from the truth falls like one over the square root of the . With a small sample, that scatter is wide: the measured rate can land far above or far below the real value purely by . With a large sample, the scatter is narrow and the rate sits close to the truth. Small n means wide scatter, large n means a tight, trustworthy number — that is the at work.
What the Numbers Show
16 ± pts from 50%
10 flips
5 ± pts from 50%
100 flips
1.6 ± pts from 50%
1,000 flips
Math-derived. A coin-flip sample's heads-rate typically lands within about 50% ÷ √n of the true 50% — smaller samples swing far wider.
The ranking trap
Order regions by some rate and the tiny populations fill both the top and the bottom of the list, not because they are special but because they are small. A village of a few hundred people can post the highest cancer rate in the country one year and one of the lowest the next, since a single case moves its rate enormously. A big city, anchored by a huge denominator, can never swing that far and stays near the . So a ranking of rates quietly becomes a ranking of who is smallest, disguised as a ranking of who is best or worst.
Why intuition fails
An extreme rate feels like a strong signal. When we see the highest or lowest number on a list, our instinct is that something real and powerful must be driving it. What we forget is the denominator underneath: how many cases and how many people the rate is actually based on. A rate of fifty percent feels equally solid whether it comes from two people out of four or from five hundred thousand out of a million, yet the first is almost meaningless and the second is rock solid. The mind reads the headline rate and skips the that decides whether to believe it.
Worked example
Flip a fair coin ten times and landing on 60 or 70 percent heads is completely ordinary; you would not blink at it. Flip the same coin a thousand times and you will sit close to 50 percent almost every time, with sixty percent now astronomically unlikely. Nothing about the coin changed between the two runs — only the . The ten-flip rate is free to wander because a single extra head shifts it by ten points, while in a thousand flips one extra head barely registers. The same leverage shows up in everyday ratings: a restaurant with 10 reviews can jump from 4.2 to 4.6 stars after a few happy customers, while one with 10,000 reviews barely moves.
How to use it
Build one habit: always ask the before reacting to a rate. When a percentage, a per-capita figure, or a ranking lands in front of you, find out how many cases and how many people sit behind it. A shocking rate built on a handful of cases deserves a shrug, not alarm. When you compare units of very different sizes, weight or shrink the noisiest small- rates toward the overall before ranking or reacting, so a tiny group cannot hijack both ends of the list. The rate is the headline; the denominator tells you whether the headline is real.
What people get wrong
People treat the most extreme early result as the most interesting result. It may simply be the noisiest result. The best school, hospital, fund, product, or player in a small can be there because of luck. Extremes are overrepresented when many small groups are ranked.
When it applies
Small- swings matter in A/B tests, early startup metrics, league tables, reviews, medical studies, election crosstabs, and quality dashboards. Be cautious when the denominator is small or when many small groups are compared. Add uncertainty ranges, require minimum sample sizes, or shrink noisy estimates toward a broader .
Source note
Tversky and Kahneman's law-of-small-numbers paper explains how people expect small samples to be more representative than they really are. The page applies that to ratings, rankings, and early metrics.
Try It
Small samples swing wild
Draw several samples of fair coin flips and watch the spread.
50 pts
spread of heads-rate
flips per sample: 10
With 10 flips per sample, the twelve draws spread across 50 percentage points. Small samples wander far from 50% on luck alone; add flips and that spread collapses toward zero.
FAQ
Why do small samples give extreme results?
With only a few observations, a single unusual case can move the rate a long way, so a small sample can land far above or far below the true value by chance alone. Large samples absorb those individual cases, so their rates stay close to the truth and rarely reach the extremes of a ranking.
What is the law of large numbers in plain terms?
It says that as you collect more observations, the average of your sample gets steadily closer to the true average and the random swings shrink. The more data you gather, the more luck cancels out, which is why a rate from thousands of cases is far more trustworthy than the same rate from a handful.
Quick Check
Why do the smallest towns often appear at BOTH the top and bottom of a 'rate per 100,000' ranking?
A
Tiny populations swing far from the true rate by chance.
B
Small towns are genuinely healthier and sicker than big cities.
C
Rates per 100,000 only work for big cities.
Sources
Belief in the law of small numbers
Primary source
Psychological Bulletin · Accessed 2026-06-20
Law of large numbers
Secondary explainer
Wikipedia · Accessed 2026-06-15
Know someone who'd like this?
Read next
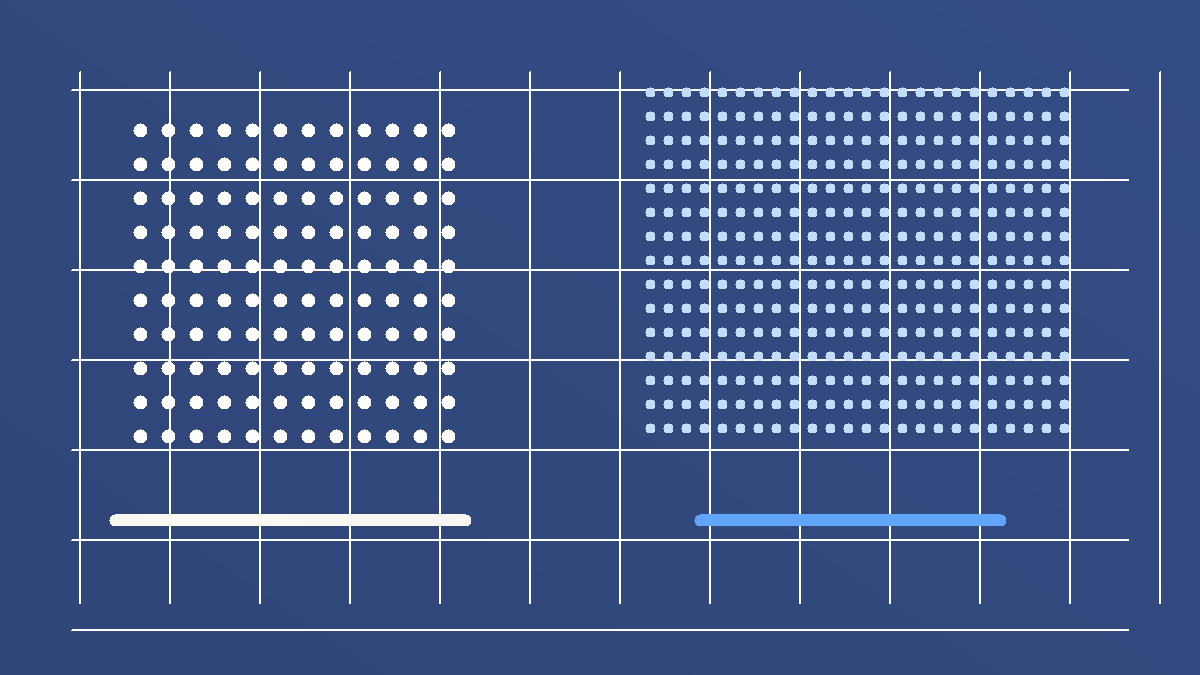
Twice as much data does not make estimates twice as precise
For many averages, cutting random error in half takes about four times as many observations. Precision has square-root returns.