Fact
Most people earn less than the average wage
In a lopsided economy, a handful of huge incomes pull the 'average' above what a typical person actually makes.
Two questions hide behind one word: the mean says how much there is per person, the median says what the middle earner makes — and for skewed incomes, "typical" means the median.
By the Math Says Yes editorial team
Human-reviewed under our source and correction standards.
How we review content
THE TRAP
We treat 'average' as 'typical', but a few extreme values bend the mean away from the middle of the group.
What this shows
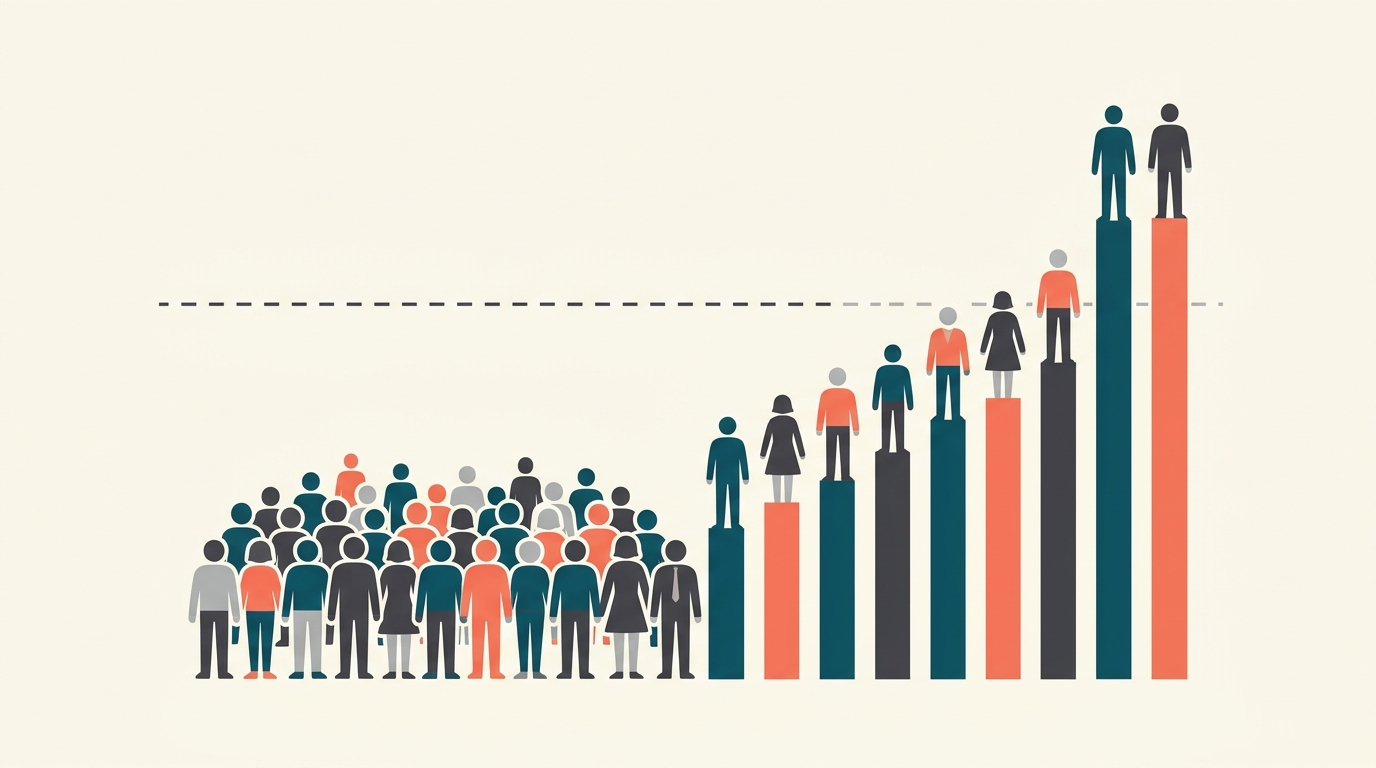
The word often hides which average is being used. The mean adds all incomes and divides by the number of people. The lines everyone up and picks the middle person. In a right-skewed income , a small number of very high incomes can lift the mean above what most people earn. The median is usually the better answer to the question what does a typical person make?
What the Numbers Show
one top earner
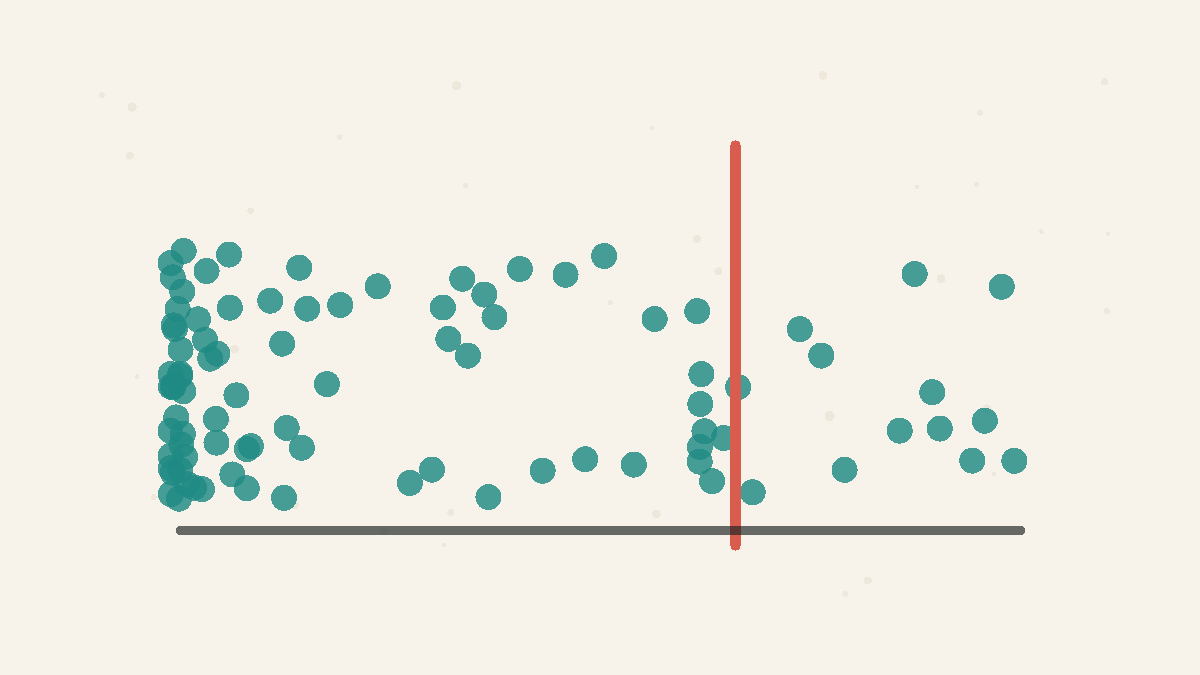
Illustrative: nine people earn 30,000; one earns 300,000. The mean becomes 57,000 while the median stays 30,000.
Why intuition fails
feels like typical because it works well for balanced data such as repeated measurements with small errors. Income is different. It has a hard lower boundary near zero and a long upper tail where rare values can be enormous. The mean is a balancing point, not a person in the middle. When the high tail is long enough, that balancing point moves upward while most observations remain below it.
Worked example
Nine people earn $30,000 and one person earns $300,000. The total is $570,000, so the is $57,000. But the stays $30,000, because the middle person is still in the group earning $30,000. In that small economy, nine out of ten people earn below the mean. The mean is mathematically correct, but it describes almost nobody in the group.
How to use it
When an describes people, ask for the , the mean, and a few percentiles. If the mean is much higher than the median, the is probably skewed upward. A chart or table will tell you more than one headline number. For wages, rent, savings, and wealth, typical usually means median, not mean.
What people get wrong
A headline says " income rose" and readers picture the typical paycheck rising — but in a skewed the mean and the middle earner can tell different stories. Both averages are legitimate; they answer different questions. The mean says how much there would be per person if everything were shared evenly — a genuinely useful number in its place, as the section on when it applies spells out. The says what the middle person earns, which is what "typical" usually means. The mistake runs in both directions: reading the mean as typical, or accusing the mean of being wrong when it is simply answering a different question.
When it applies
This pattern appears in income, wealth, company size, city , donations, streaming views, and any with a long right tail. Ask for both and when typical experience matters. Use the mean when totals matter, such as total payroll or total spending, and the median when the middle case matters.
Source note
The household income summaries lean on the Census historical income tables. This page uses a simplified example to show why income can sit above what many households experience when the is skewed.
Try It
Mean vs. median income
Add high earners and watch the average climb.
0 high earners added
38k
average, k
38k
median, k
With no high earners added, the mean and median agree at 38k — the average still describes a typical person. Add a few and watch them split.
FAQ
How can most people be below average?
Because the mean is pulled by size, not just by count. One very high income can add enough money to raise the mean above many ordinary incomes. The median, which looks for the middle person, is not pulled upward in the same way.
Is the median always better?
No. The median is better for describing a typical person in skewed data. The mean is better when totals matter, such as total payroll or total income per person. The right average depends on the question.
What should I ask for instead of average wage?
Ask for median wage, mean wage, and percentiles such as the 10th, 25th, 75th, and 90th. That combination shows both the typical person and the shape of the distribution.
Quick Check
If a few people earn enormous salaries, what happens to the mean versus the median?
A
The mean rises above the median
B
Both fall
C
The median rises above the mean
D
Both stay exactly equal
Sources
Historical Income Tables: Households
Authoritative source
U.S. Census Bureau · Accessed 2026-06-20
Income Inequality
Secondary explainer
Our World in Data · Accessed 2026-06-14
Know someone who'd like this?
Read next
Mean vs median: which average should you use?
The mean shares the total equally. The median finds the middle case. In skewed data, those can tell very different stories.