Concept
Averages Mislead
The mean adds everything up and divides, so a few extreme values can drag it far from the typical case. In skewed data the median — the middle value — better represents what is normal. Ask about the shape of the data, not just its average.
Lessons
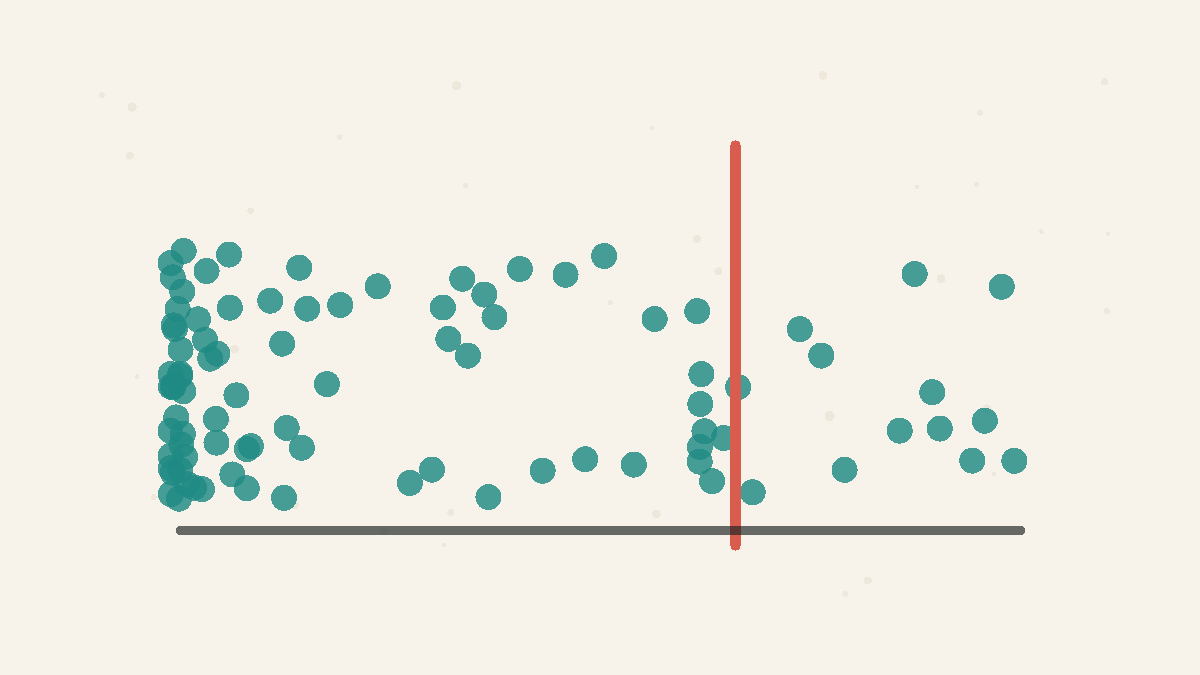
Averages Hide the Shape
A single number cannot capture a lopsided distribution.
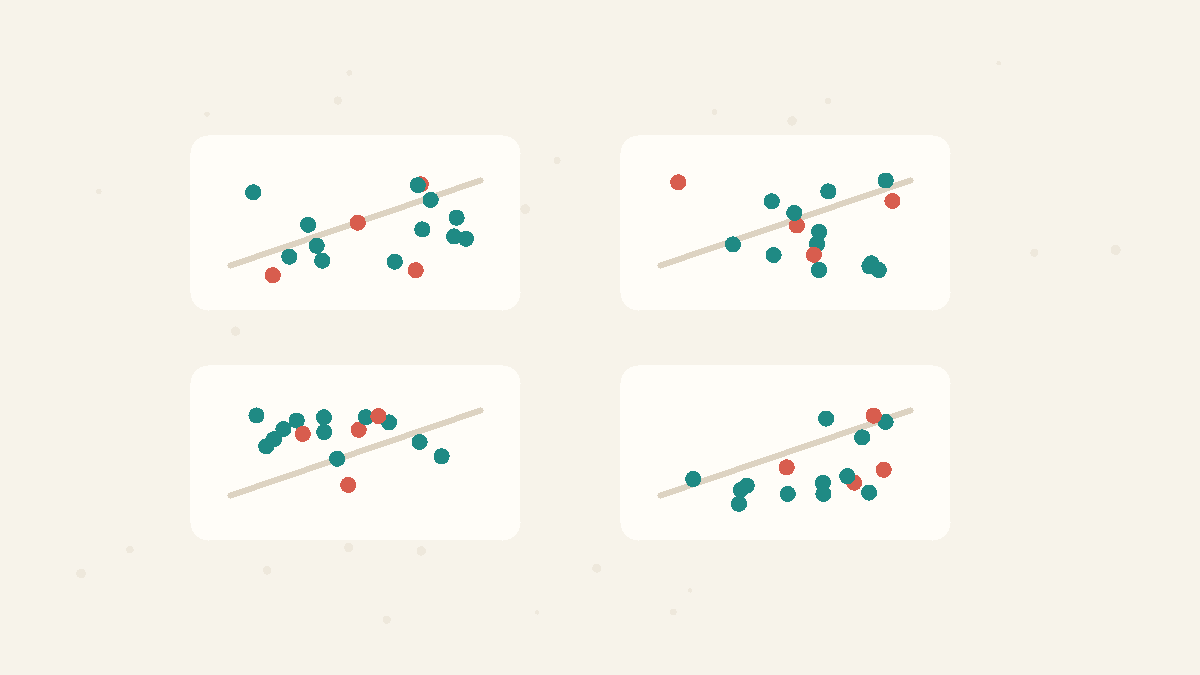
Summaries Need Pictures
Means, variances, correlations, and regression lines can match while the underlying data tell completely different stories.
Related Facts
Data Tricks
5 min · easy
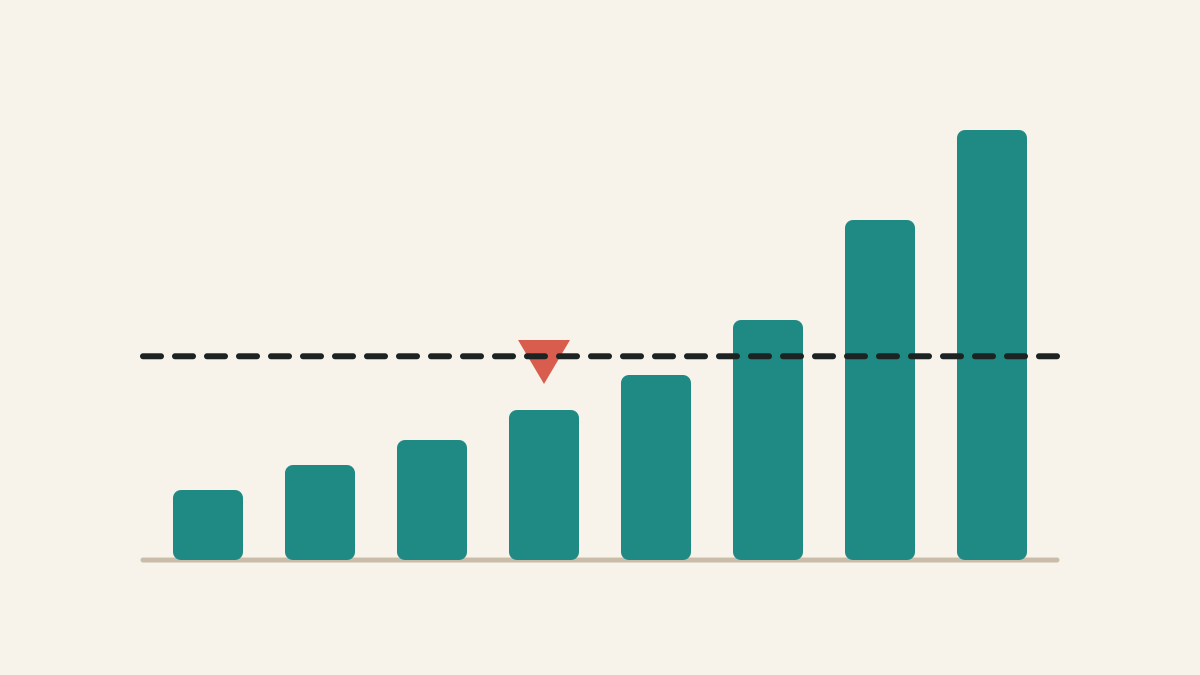
Mean vs median: which average should you use?
The mean shares the total equally. The median finds the middle case. In skewed data, those can tell very different stories.
Data Tricks
4 min · easy
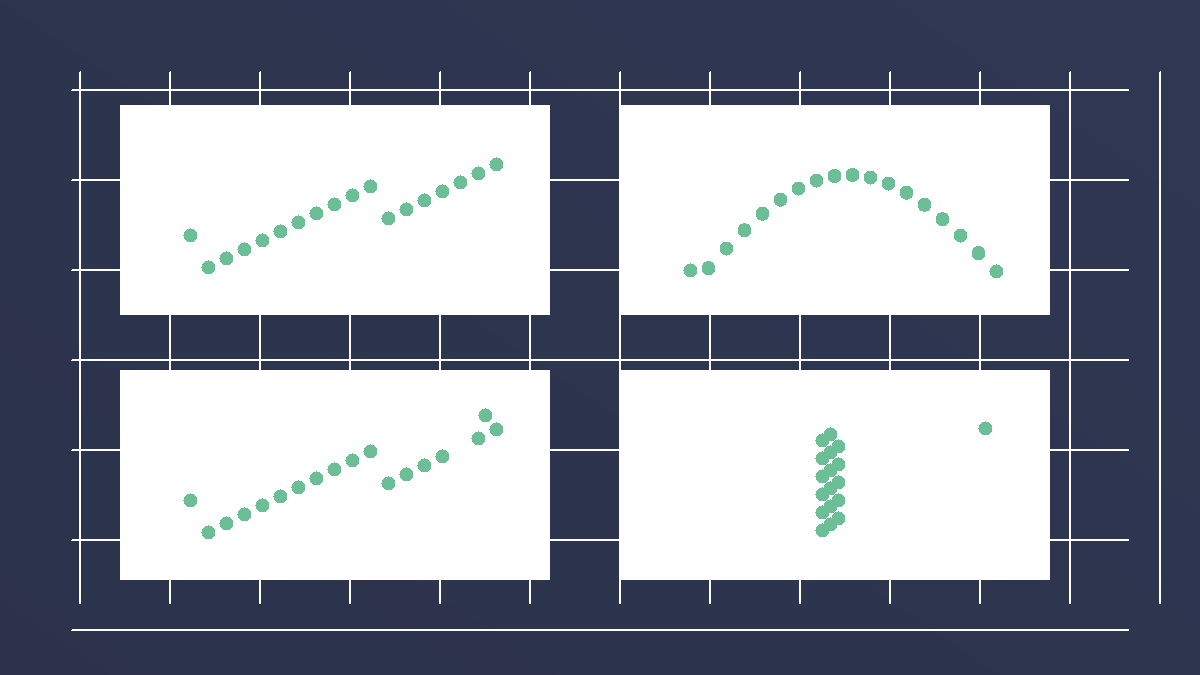
Anscombe's quartet has the same statistics and different stories
Four datasets can share almost the same mean, variance, correlation, and regression line, yet look completely different when plotted.
Data Tricks
4 min · easy
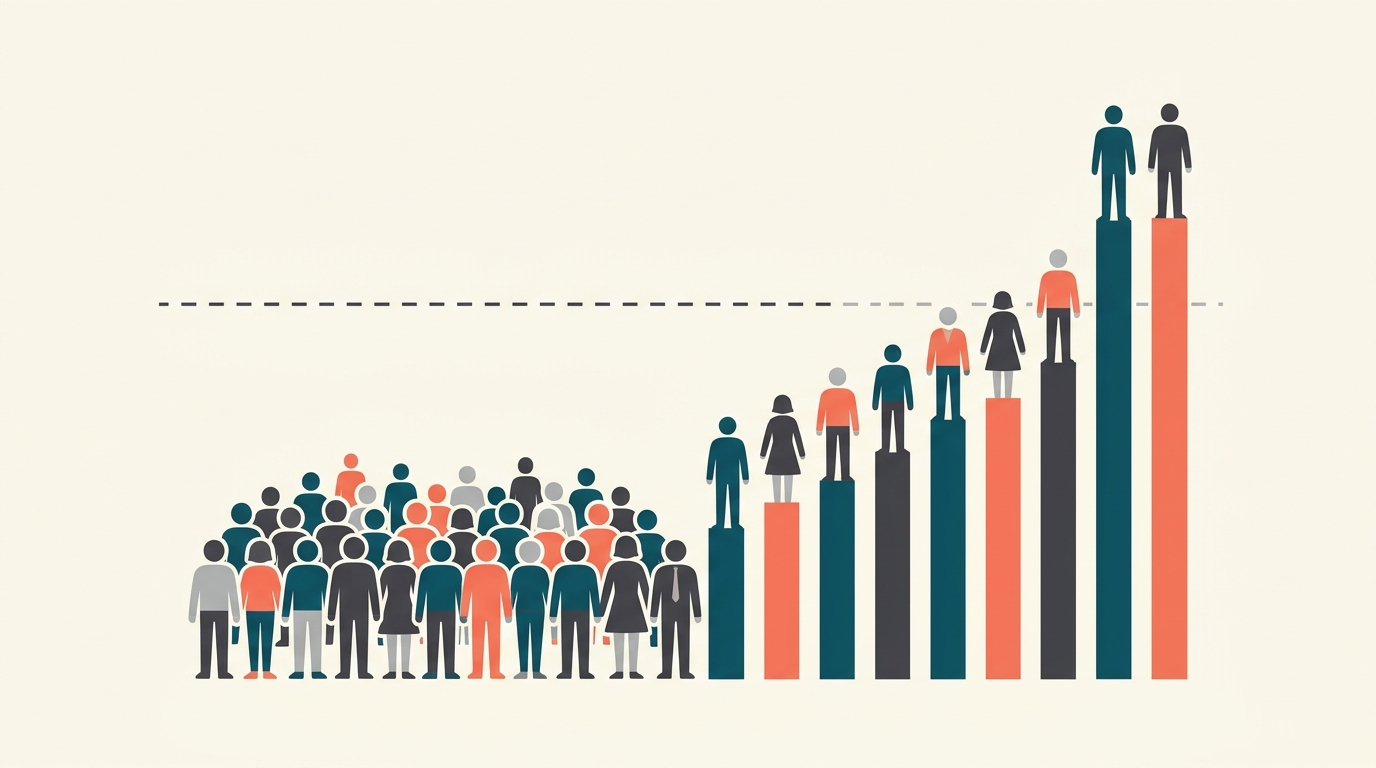
Most people earn less than the average wage
In a lopsided economy, a handful of huge incomes pull the 'average' above what a typical person actually makes.