Fact
Mean vs median: which average should you use?
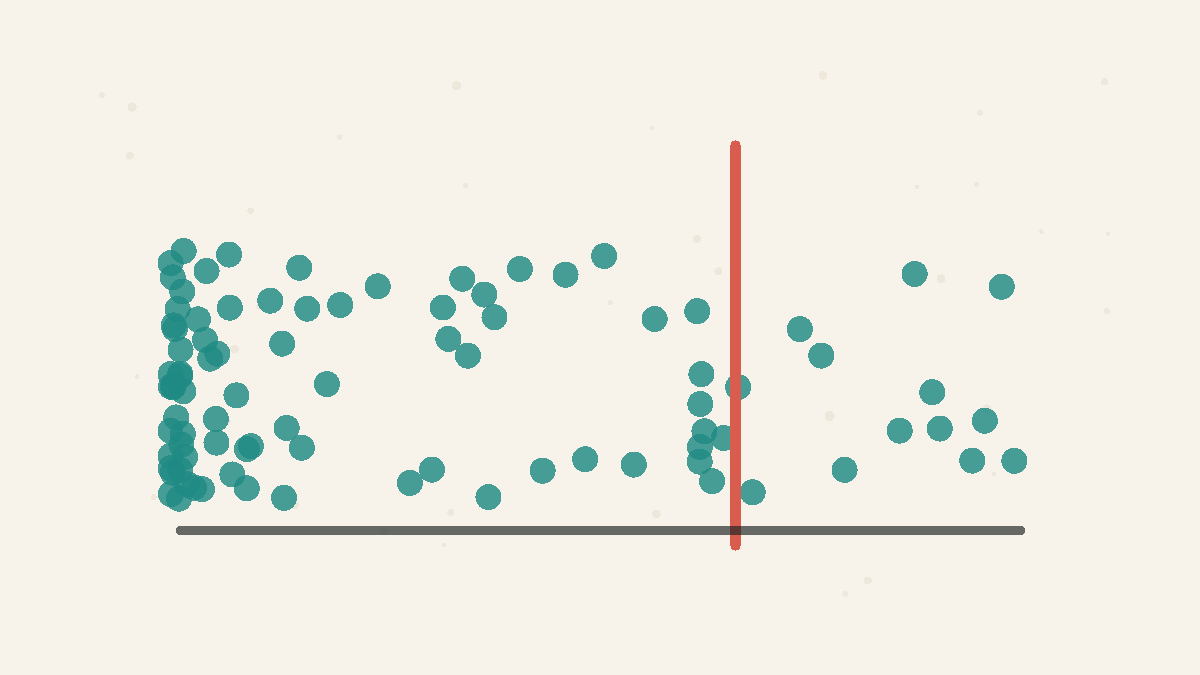
The mean shares the total equally. The median finds the middle case. In skewed data, those can tell very different stories.
Mean and median are both measures of center, but the mean is pulled by extreme values while the median tracks the middle observation.
By the Math Says Yes editorial team
Human-reviewed under our source and correction standards.
How we review content
THE TRAP
Calling both numbers averages and forgetting that one follows the total while the other follows the middle case.
The short difference
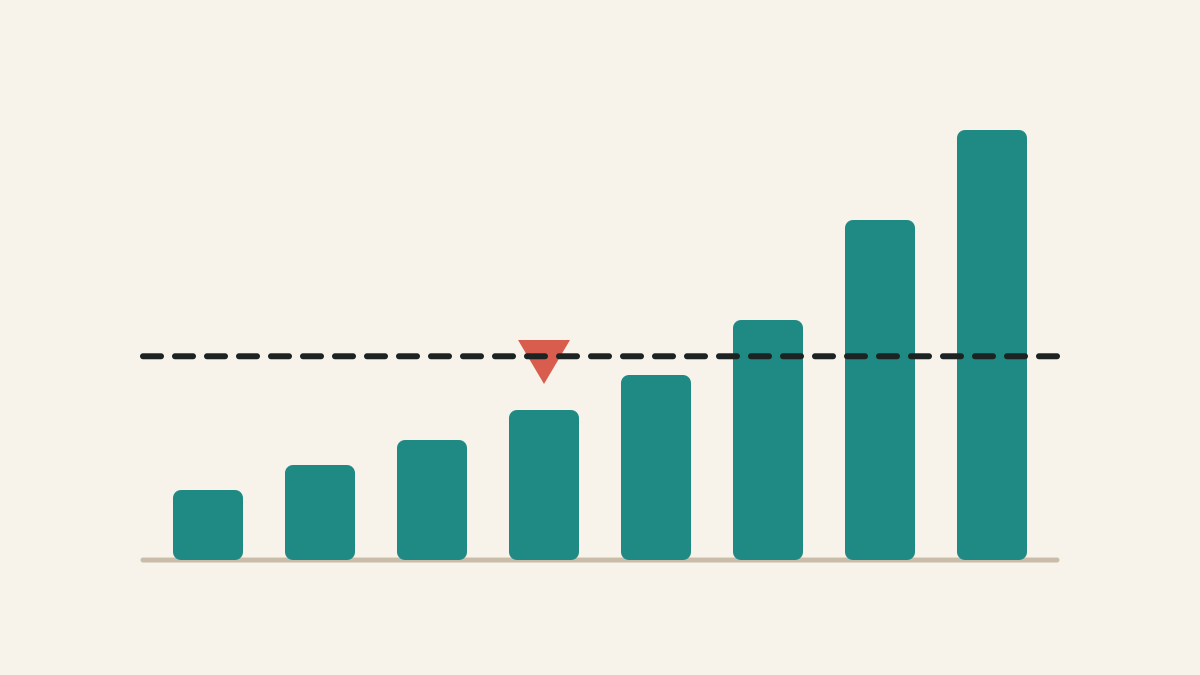
The answers a sharing question: if the total were spread equally across every observation, what would each one get? The answers a position question: what value sits in the middle after all observations are ordered? When data are balanced and roughly symmetric, the two are often close. When data are skewed, a few very large or very small values can pull the mean away from what most observations look like.
Quick Comparison
Mean
Median
What it answers
What would everyone get if the total were shared equally?
What value sits in the middle after sorting?
Common mistake
Using it for skewed data as if outliers did not matter.
Treating it as if it described totals or budgets.
Use when
Totals matter or the distribution is roughly symmetric.
You want the typical case in skewed data.
What the Numbers Show
one high outlier
Nine house prices are 250,000 and one is 2.5 million. The mean is 475,000, but the median stays 250,000.
Worked example
Take ten house prices on one street: nine at 250,000 and one at 2.5 million. The is 475,000 because the expensive house adds a lot to the total. The is 250,000 because the middle of the ordered list still sits among the nine ordinary homes. Both numbers are correct. Only one describes what a typical house on that street costs.
What people get wrong
Asking for “the ” assumes there is only one sensible center. A mean can be useful for totals, budgets, and quantities that really do add up. A is often better for typical income, house prices, waiting times, and other skewed quantities. Another mistake is treating a gap between mean and median as a problem. That gap is information: it says the data have a tail or outliers.
When it applies
Use the when values are fairly symmetric, when every unit contributes to a total, or when the total itself matters. Use the when you want the typical case and the data have outliers or a long tail. For public claims, the best answer is often to show both. If the mean and median are close, one number may be enough. If they are far apart, the needs more explanation.
Source note
The Census household income tables show a domain where medians are central, because income distributions are skewed. Our World in Data is included for broader context on income inequality and shape. The page uses a small illustrative salary list rather than a live national estimate, because the goal is to explain the mechanical difference between and .
Try It
Mean vs. median income
Add high earners and watch the average climb.
0 high earners added
38k
average, k
38k
median, k
With no high earners added, the mean and median agree at 38k — the average still describes a typical person. Add a few and watch them split.
FAQ
Is median the same as average?
Median is one kind of average in the loose sense of a measure of center, but it differs from the arithmetic mean: the median is the middle value after sorting the data.
Why is median income usually lower than mean income?
Income has a long upper tail. A small number of very high incomes pull the mean upward, while the median stays near the middle household.
Quick Check
Nine homes cost 250k and one costs 2.5m. Which measure better describes a typical home?
A
The range
B
The median
C
The mean
Sources
Historical Income Tables: Households
Authoritative source
U.S. Census Bureau · Accessed 2026-06-20
Income Inequality
Secondary explainer
Our World in Data · Accessed 2026-06-14
Know someone who'd like this?
Read next
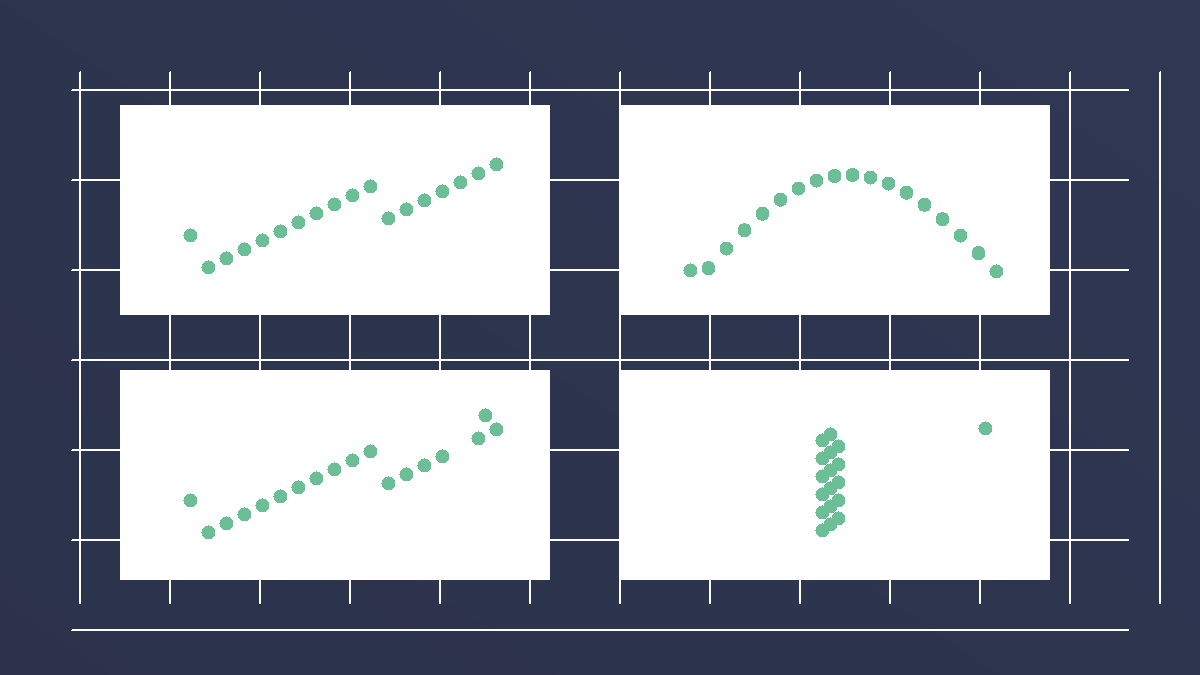
Anscombe's quartet has the same statistics and different stories
Four datasets can share almost the same mean, variance, correlation, and regression line, yet look completely different when plotted.
Related Comparisons
P-value vs confidence interval: what each one tells you
P-values and confidence intervals answer different questions. Use the p-value for evidence against a null model, and the interval for the size and uncertainty of the effect.
Relative risk vs absolute risk: the difference that changes decisions
Relative risk can make small changes sound large. Absolute risk puts the change back on a real scale, such as 2 in 100 becoming 3 in 100.
Correlation vs causation: why moving together is not proof
Correlation is a pattern. Causation is a claim about mechanism. To move from one to the other, you need timing, a fair comparison, and alternative explanations ruled out.
Standard error vs standard deviation: spread vs precision
Standard deviation is about variability in the data. Standard error is about variability in an estimate across repeated samples.
Concepts
Averages Mislead
The mean adds everything up and divides, so a few extreme values can drag it far from the typical case. In skewed data the median — the middle value — better represents what is normal. Ask about the shape of the data, not just its average.
Summary Statistics
Summary statistics compress a dataset into numbers such as the mean, variance, correlation, or regression line. They are useful, but they can hide shape, outliers, clusters, and curved relationships that a graph would reveal immediately.