Lesson
Averages Hide the Shape
A single number cannot capture a lopsided distribution.
By the Math Says Yes editorial team
Human-reviewed under our source and correction standards.
How we review content
An average is a compression
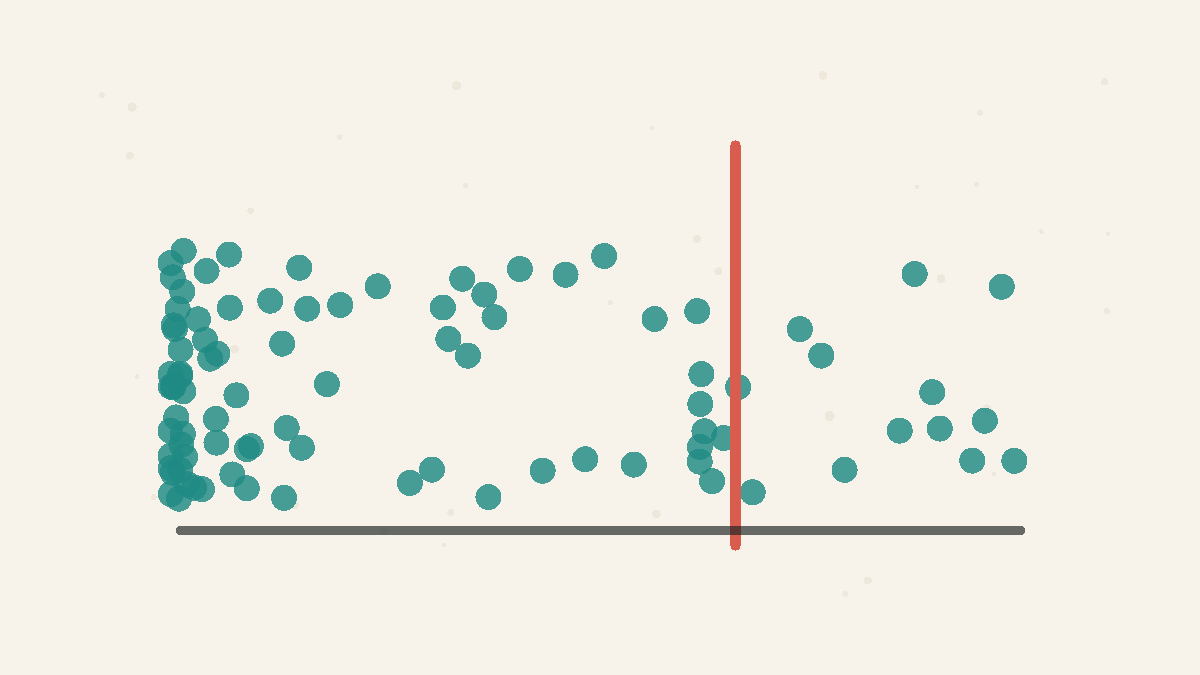
The turns many values into one number. That is useful when the values cluster fairly evenly around the center, but it hides important shape when the is lopsided. Income, wealth, house prices, waiting times, and audience sizes often have a long upper tail. A few extreme values pull the mean upward, so the average can sit above what most people actually experience.
Mean and median answer different questions
The asks what everyone would get if the total were shared equally. The asks what value sits in the middle when all observations are ordered. Both can be true and useful, but they describe different aspects of the data. In a skewed , the distance between mean and median is itself a clue. It tells you the group is not well represented by one tidy center.
Shape matters as much as center
A group can have the same and very different lived realities. One classroom might have everyone near 70 points; another might have half near 40 and half near 100. The average is the same, but the situation is not. To understand a dataset, ask for spread, percentiles, and the shape of the tail. The center tells you where the balance point is; the shape tells you who is near it.
What to ask before quoting an average
Before you quote an , ask whether the is symmetric, whether outliers are present, and whether the tells a different story. If the answer is yes, use the average with context instead of as a complete summary. For public claims, a strong presentation often includes the mean, the median, and one or two percentiles. That makes the number harder to misuse and easier to interpret.
FAQ
Why can most people be below average?
In a skewed distribution, a small number of very high values can pull the mean upward. The median may show that most observations are lower than that mean.
When should I prefer the median?
Prefer the median when the data has outliers or a long tail, especially for income, wealth, prices, waiting times, and other skewed real-world quantities.
See it in action
Mean vs median: which average should you use?
Mean and median are both measures of center, but the mean is pulled by extreme values while the median tracks the middle observation.
Most people earn less than the average wage
Two questions hide behind one word: the mean says how much there is per person, the median says what the middle earner makes — and for skewed incomes, "typical" means the median.
Quick Check
Nine homes cost 250k and one costs 2.5m. Which measure better describes a typical home?
A
The range
B
The median
C
The mean