Fact
Standard error vs standard deviation: spread vs precision
Standard deviation describes spread among individual values. Standard error describes uncertainty in an estimate such as the mean.
Standard deviation is about variability in the data. Standard error is about variability in an estimate across repeated samples.
By the Math Says Yes editorial team
Human-reviewed under our source and correction standards.
How we review content
THE TRAP
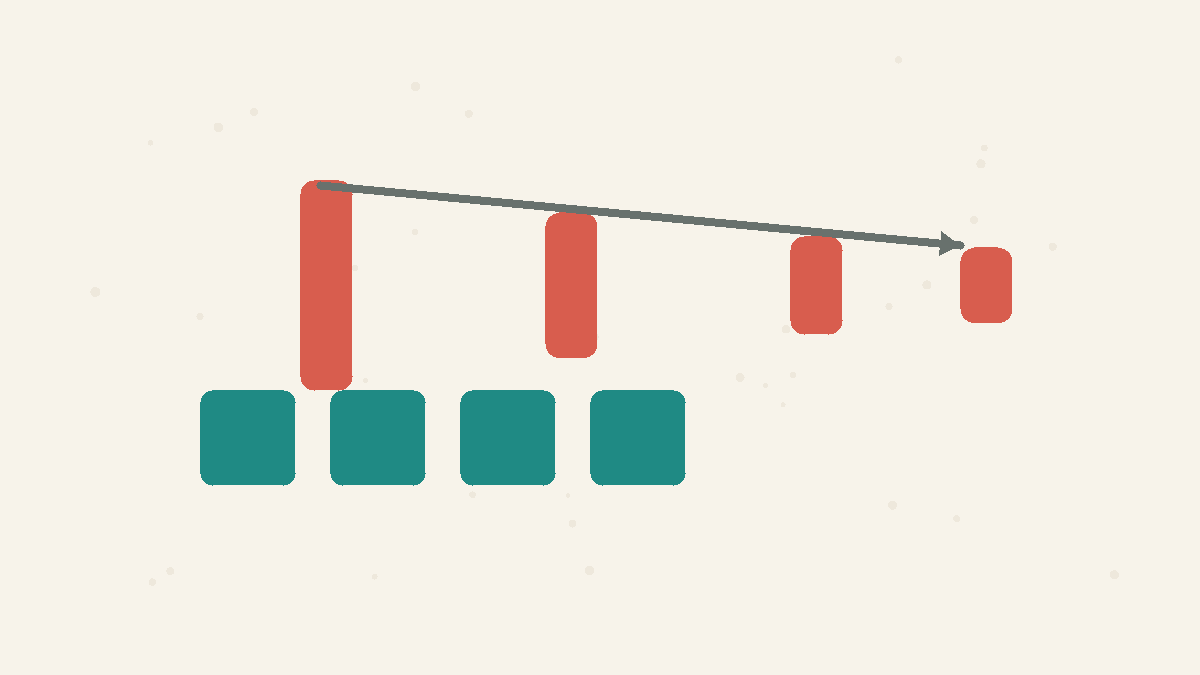
Seeing smaller error bars and assuming the raw data are less variable, when the chart may only be showing the estimate more precisely.
The short difference
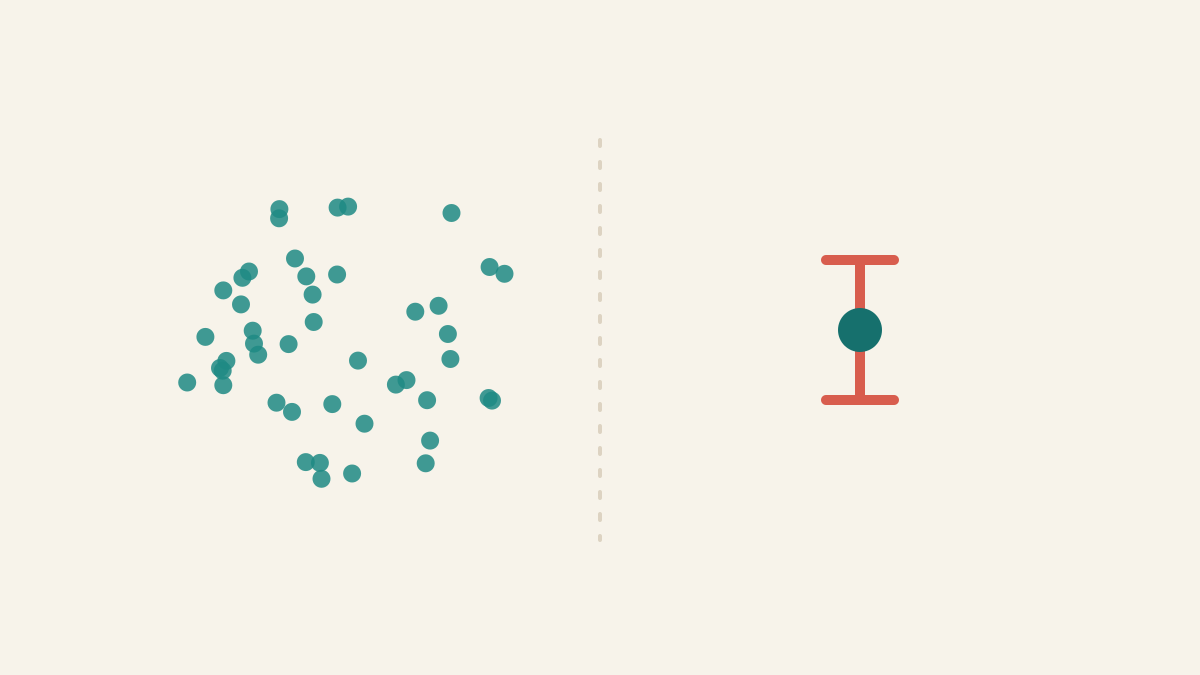
describes how scattered individual observations are around their . If people in a group have very different heights, incomes, or scores, the standard deviation is large. describes how much an estimate would wobble if the study were repeated. The standard error of the mean gets smaller as the grows, because repeated samples estimate the average more precisely.
Quick Comparison
Standard error
Standard deviation
What it answers
How much would this estimate vary across repeated samples?
How spread out are individual observations?
Common mistake
Reading it as if it showed the spread of the raw data.
Reading it as if it showed the precision of the mean.
Use when
You report uncertainty around an estimate.
You describe variability among observations.
What the Numbers Show
spread among individual scores
12 points
wobble of 16-student average
3 points
Individual scores vary by about 12 points. The average of 16 students would typically wobble by about 3 points across repeated samples.
Worked example
Imagine test scores have a of 12 points. That number describes the spread of individual scores. If you 16 independent students and compute their score, the of that mean is about 12 divided by the square root of 16, which is 3 points. The students are not suddenly similar within 3 points. The mean is estimated with about 3 points of sampling wobble.
What people get wrong
bars look like they show the spread of the raw data. They usually do not. Standard error bars can become tiny in a large even when individual observations remain highly variable. That can make results look cleaner than the underlying reality. If you want to describe people, items, or observations, ask for . If you want precision of a or estimate, ask for standard error or a .
When it applies
Use when summarizing variation among individual observations: exam scores, blood pressure values, delivery times, prices, or product weights. Use when summarizing how uncertain an estimate is: the score, the difference between means, a coefficient, or a survey estimate. In reports, label error bars clearly. A reader should never have to guess whether the bars describe data spread or estimate precision.
Source note
Altman and Bland's BMJ statistics note directly distinguishes standard deviations from standard errors and warns against confusing their interpretation. The standard-error reference supplies the square-root relationship used in the worked example. The chart is illustrative so the arithmetic is visible rather than tied to a particular empirical dataset.
FAQ
Should I report standard deviation or standard error?
Report standard deviation to describe variability among observations. Report standard error or a confidence interval to describe uncertainty in an estimate.
Why is standard error smaller than standard deviation?
For a mean, standard error is usually standard deviation divided by the square root of sample size. Averaging reduces sampling wobble, but it does not erase variation in individual observations.
Quick Check
A mean becomes more precise after collecting more observations. Which quantity should usually shrink?
A
The standard error
B
Both must shrink equally
C
The standard deviation must shrink
Sources
Standard deviations and standard errors
Primary source
BMJ · Accessed 2026-06-20
Standard error
Secondary explainer
Wikipedia · Accessed 2026-06-16
Know someone who'd like this?
Read next
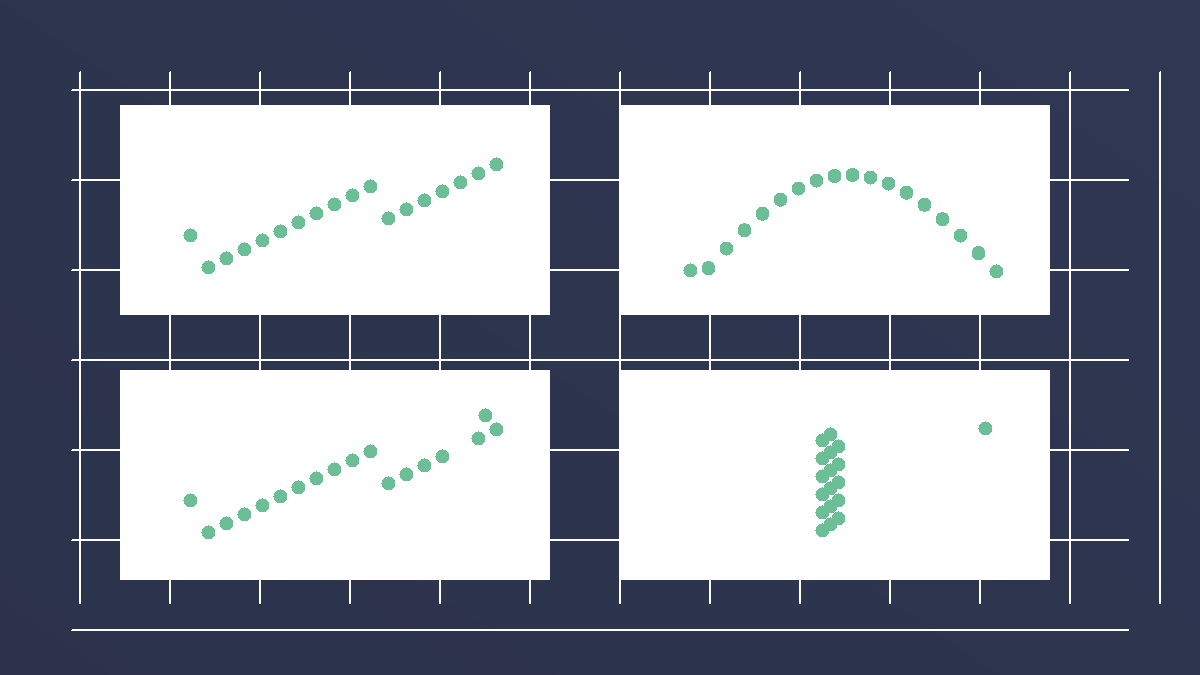
Anscombe's quartet has the same statistics and different stories
Four datasets can share almost the same mean, variance, correlation, and regression line, yet look completely different when plotted.
Related Comparisons
P-value vs confidence interval: what each one tells you
P-values and confidence intervals answer different questions. Use the p-value for evidence against a null model, and the interval for the size and uncertainty of the effect.
Mean vs median: which average should you use?
Mean and median are both measures of center, but the mean is pulled by extreme values while the median tracks the middle observation.
Relative risk vs absolute risk: the difference that changes decisions
Relative risk can make small changes sound large. Absolute risk puts the change back on a real scale, such as 2 in 100 becoming 3 in 100.
Correlation vs causation: why moving together is not proof
Correlation is a pattern. Causation is a claim about mechanism. To move from one to the other, you need timing, a fair comparison, and alternative explanations ruled out.
Concepts
Standard Deviation
Standard deviation describes how spread out individual observations are around their mean. It is about variation in the data itself. Standard error is different: it describes how much an estimate such as the sample mean would vary across repeated samples.
Standard Error
Standard error is the typical sampling wobble of an estimate such as a mean. For independent observations, the standard error of a mean shrinks with the square root of the sample size, so cutting the error in half usually takes four times as much data.
Summary Statistics
Summary statistics compress a dataset into numbers such as the mean, variance, correlation, or regression line. They are useful, but they can hide shape, outliers, clusters, and curved relationships that a graph would reveal immediately.