Concept
Standard Error
Standard error is the typical sampling wobble of an estimate such as a mean. For independent observations, the standard error of a mean shrinks with the square root of the sample size, so cutting the error in half usually takes four times as much data.
Lessons
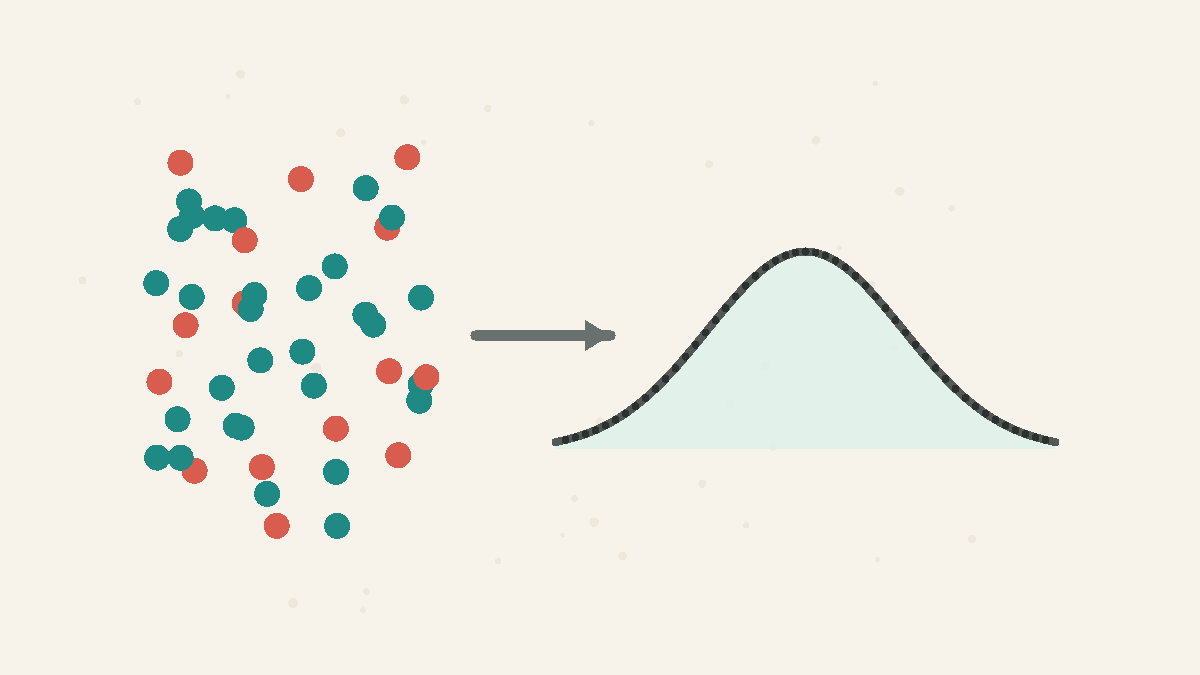
Averages Stabilize in Shape
Individual observations can be messy, skewed, or spiky, yet averages of many independent observations often settle into a predictable bell-shaped pattern.

Precision Has Square-Root Returns
More data helps, but random error shrinks slowly: to halve the noise in an average, you usually need four times as many observations.
Related Facts
Data Tricks
5 min · easy
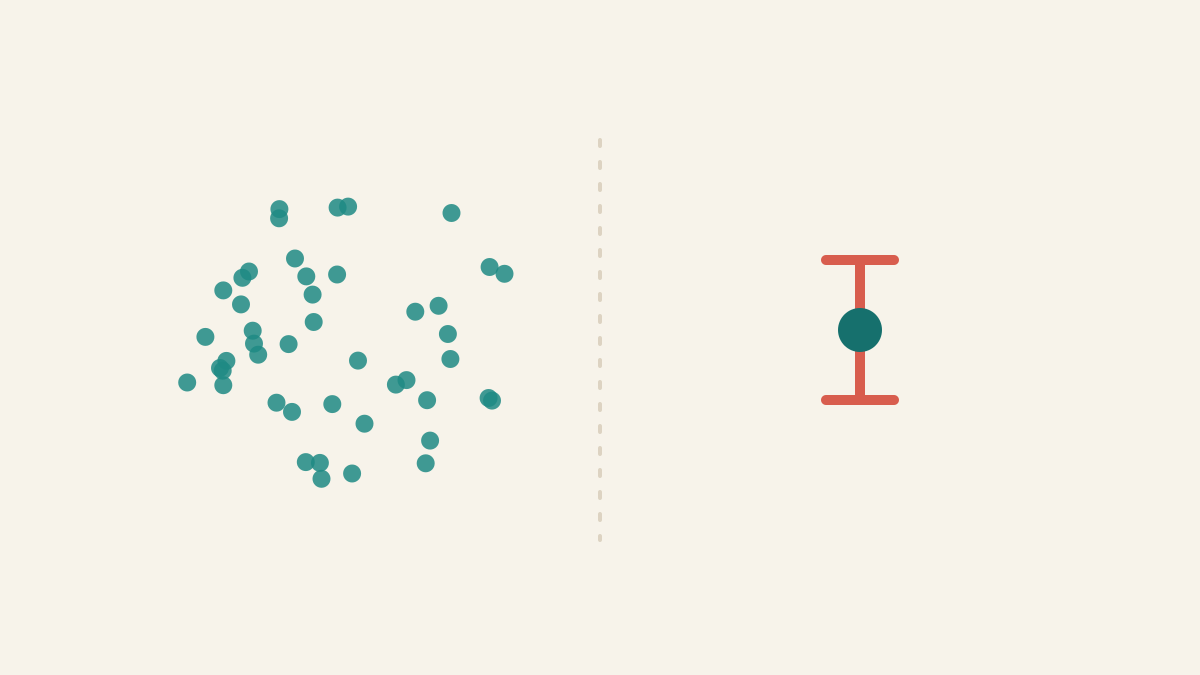
Standard error vs standard deviation: spread vs precision
Standard deviation describes spread among individual values. Standard error describes uncertainty in an estimate such as the mean.
Probability
4 min · medium
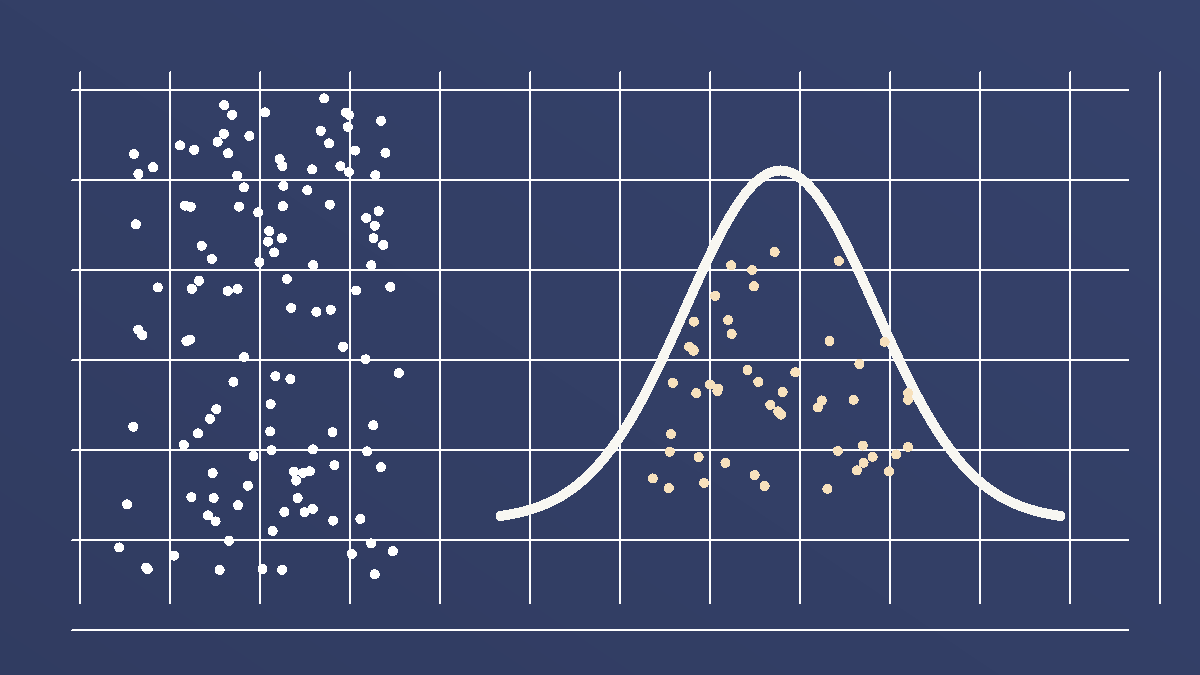
The central limit theorem makes averages look normal
Individual data can be skewed or messy, while averages of many independent observations often form a neat bell-shaped pattern.
Risk & Decisions
4 min · medium
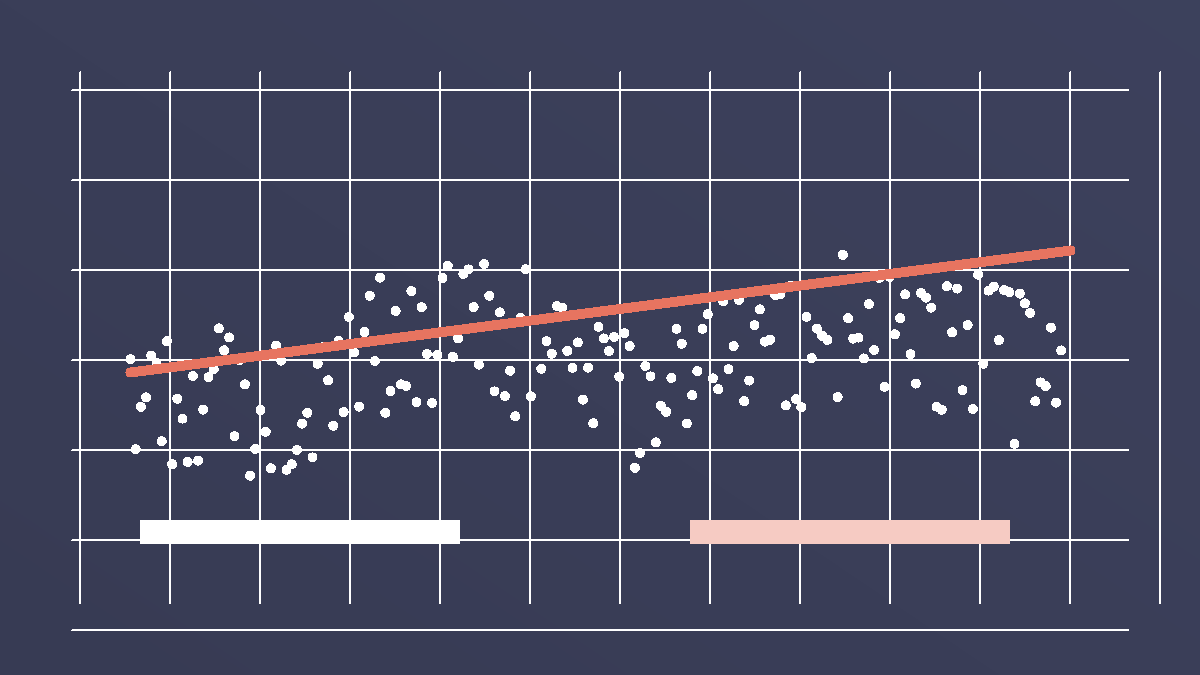
Statistical power: a small study can miss a real effect
A study can report 'no clear effect' simply because it was too small and noisy to spot a real one.
Data Tricks
4 min · easy
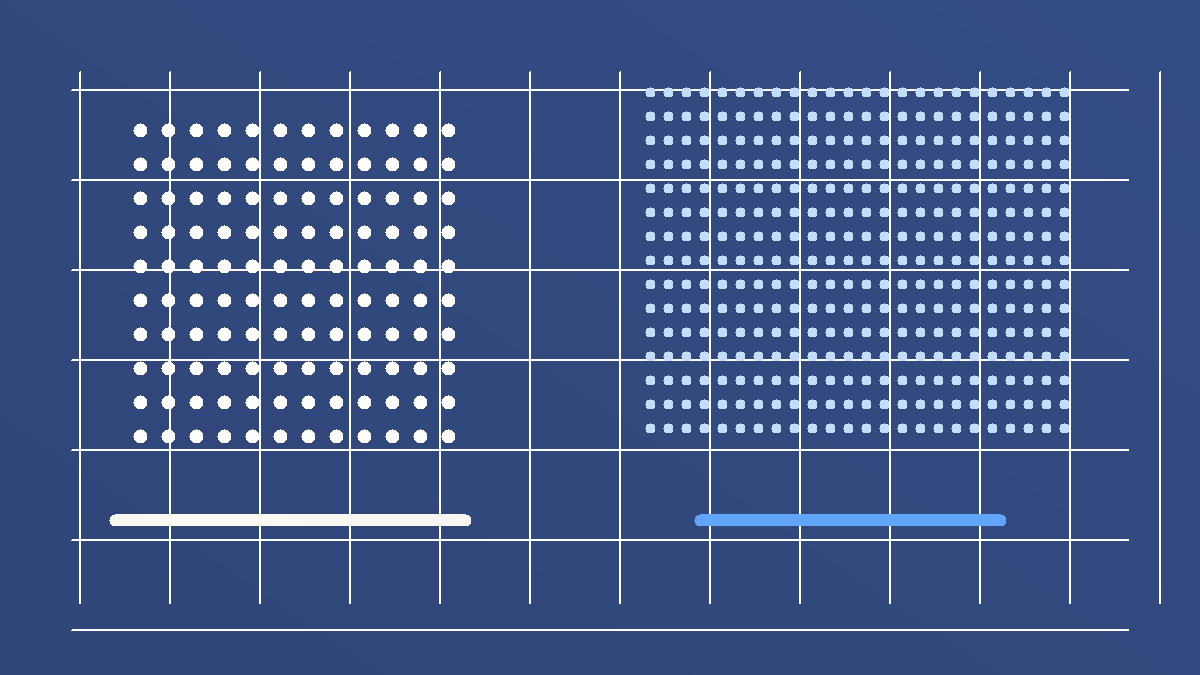
Twice as much data does not make estimates twice as precise
For many averages, cutting random error in half takes about four times as many observations. Precision has square-root returns.