Fact
P-value vs confidence interval: what each one tells you
A p-value asks whether the data look surprising under a null model. A confidence interval asks which effect sizes remain plausible.
P-values and confidence intervals answer different questions. Use the p-value for evidence against a null model, and the interval for the size and uncertainty of the effect.
By the Math Says Yes editorial team
Human-reviewed under our source and correction standards.
How we review content
THE TRAP
Thinking the p-value and the confidence interval are interchangeable because both often appear in the same study table.
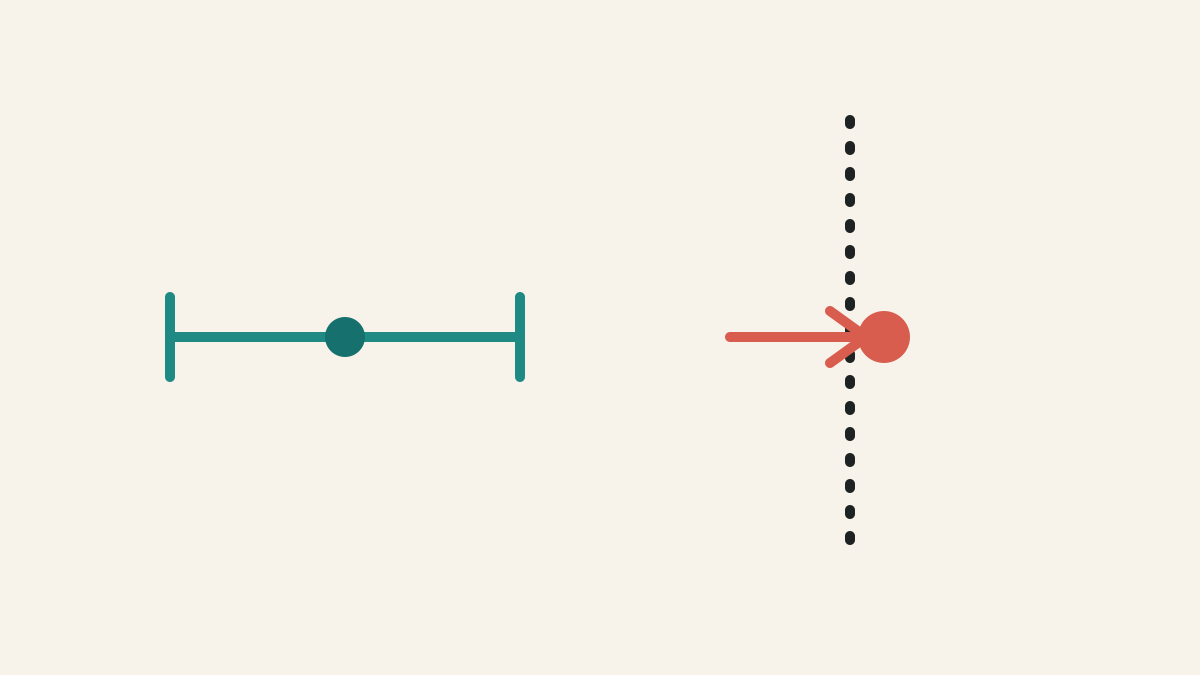
The short difference
A starts with a null model, such as no difference between two groups, and asks how unusual the observed data would be if that model were true. A starts with an estimate, such as a difference, and shows a range of effect sizes that remain plausible under the method used. The first is mainly about surprise under a model. The second is mainly about magnitude and precision.
Quick Comparison
P-value
Confidence interval
What it answers
If there were no real improvement, how unusual would this result be?
Which improvement sizes still fit the data?
Common mistake
Treating p as the probability that the claim is false.
Treating 95% as a personal probability for one finished interval.
Use when
You need evidence against a specific null model.
You need size, direction, and precision of the effect.
Worked example
Suppose a study estimates that a treatment improves a score by 4 points, with a 95% from 1 to 7 points and p = 0.02 for the of zero improvement. The says that data at least this favorable would be unusual if the true improvement were exactly zero under the tested model. The interval says the effect is estimated around 4 points, but values from 1 to 7 remain compatible with the procedure.
What people get wrong
The common mistake is reading p = 0.02 as a 98% that the claim is true, or reading a 95% as a personal 95% probability that the finished interval contains the true value. Neither wording is the frequentist definition. Another mistake is ignoring : a tiny can come from a huge and a trivial effect, while a wide interval can show that a study has not pinned down the practical size of the effect.
When it applies
Use a when the question is whether the observed data are hard to reconcile with a specific null model. Use a when the question is how big the effect could reasonably be. In most applied reading, you want both: the p-value can flag a surprising pattern, while the interval helps you judge whether the pattern is large enough, precise enough, and useful enough to matter.
Source note
The ASA statement sets out the limits of interpretation, especially the warning that p-values do not measure the that a hypothesis is true or the size of an effect. Morey and colleagues directly discuss common confidence-interval fallacies. Together, those sources support the page’s practical rule: use p-values and intervals as complementary summaries, not interchangeable proof machines.
Try It
P-value vs. confidence interval
Move the estimate and watch both summaries change.
estimate: +1.5
null value
estimate
-0.5 to +3.5
95% interval
.134
p-value
At an estimate of +1.5, the 95% interval still spans the null value and p = .134. The two agree: an interval that includes 0 is exactly the case where p stays above 0.05.
FAQ
Is a confidence interval better than a p-value?
It is not simply better; it answers a different question. A confidence interval gives effect size and uncertainty, while a p-value summarizes surprise under a null model.
Can a result be statistically significant but still unimportant?
Yes. With a large enough sample, even a tiny effect can produce a small p-value. The confidence interval and the practical context tell you whether the effect matters.
Quick Check
Which result shows the range of effect sizes still compatible with the data?
A
The confidence interval
B
The p-value alone
C
The sample mean alone
Sources
Confidence interval
Secondary explainer
Wikipedia · Accessed 2026-06-16
The ASA's Statement on p-Values: Context, Process, and Purpose
Authoritative source
The American Statistician · Accessed 2026-06-20
The fallacy of placing confidence in confidence intervals
Primary source
Psychonomic Bulletin & Review · Accessed 2026-06-20
p-value
Secondary explainer
Wikipedia · Accessed 2026-06-16
Know someone who'd like this?
Read next
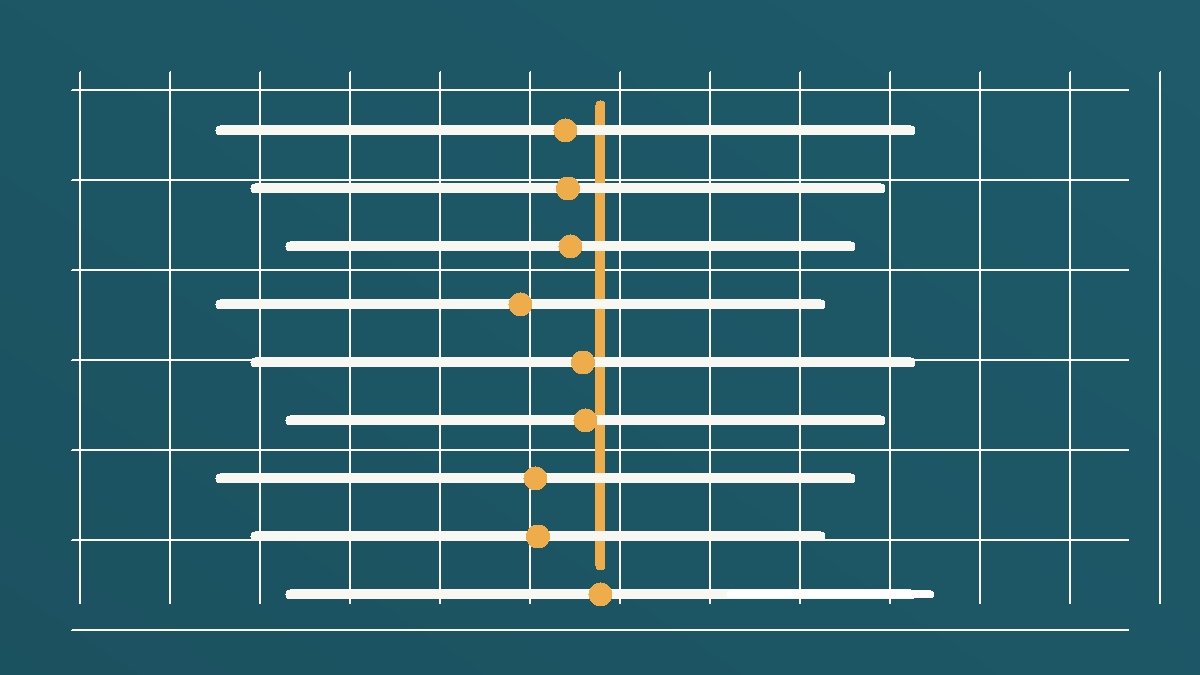
A 95% confidence interval is not a 95% promise
A 95% confidence interval means the method works 95% of the time in repeated samples, not that this exact range now has a 95% chance of holding the truth.
Related Comparisons
Mean vs median: which average should you use?
Mean and median are both measures of center, but the mean is pulled by extreme values while the median tracks the middle observation.
Relative risk vs absolute risk: the difference that changes decisions
Relative risk can make small changes sound large. Absolute risk puts the change back on a real scale, such as 2 in 100 becoming 3 in 100.
Correlation vs causation: why moving together is not proof
Correlation is a pattern. Causation is a claim about mechanism. To move from one to the other, you need timing, a fair comparison, and alternative explanations ruled out.
Standard error vs standard deviation: spread vs precision
Standard deviation is about variability in the data. Standard error is about variability in an estimate across repeated samples.
Concepts
Confidence Intervals
A confidence interval is a range produced by a method that captures the true value a stated share of the time across repeated samples. It describes uncertainty in the estimating method, not a personal guarantee that one already-computed interval contains the truth.
P-Values
A p-value is the probability of seeing data at least this extreme if a specific null model were true. It is not the probability that the claim is false, not the chance the result was random, and not a measure of how large or important the effect is.
Uncertainty
The honest range left after measurement limits, model choices, and missing information. A single number can be useful as a midpoint, but decisions usually need plausible low and high values too. Good estimates state the assumptions that would move the answer.
Lessons
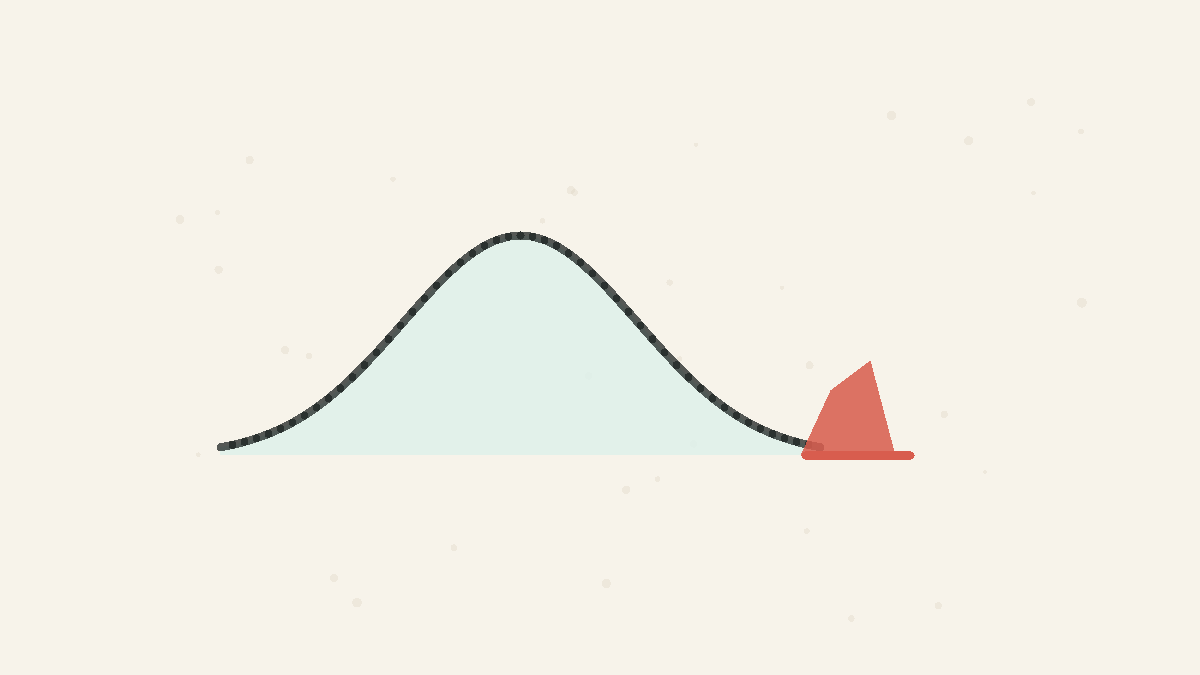
Small P Is Not Proof
A small p-value says the data would be surprising under a null model, not that the claim is probably true or important.
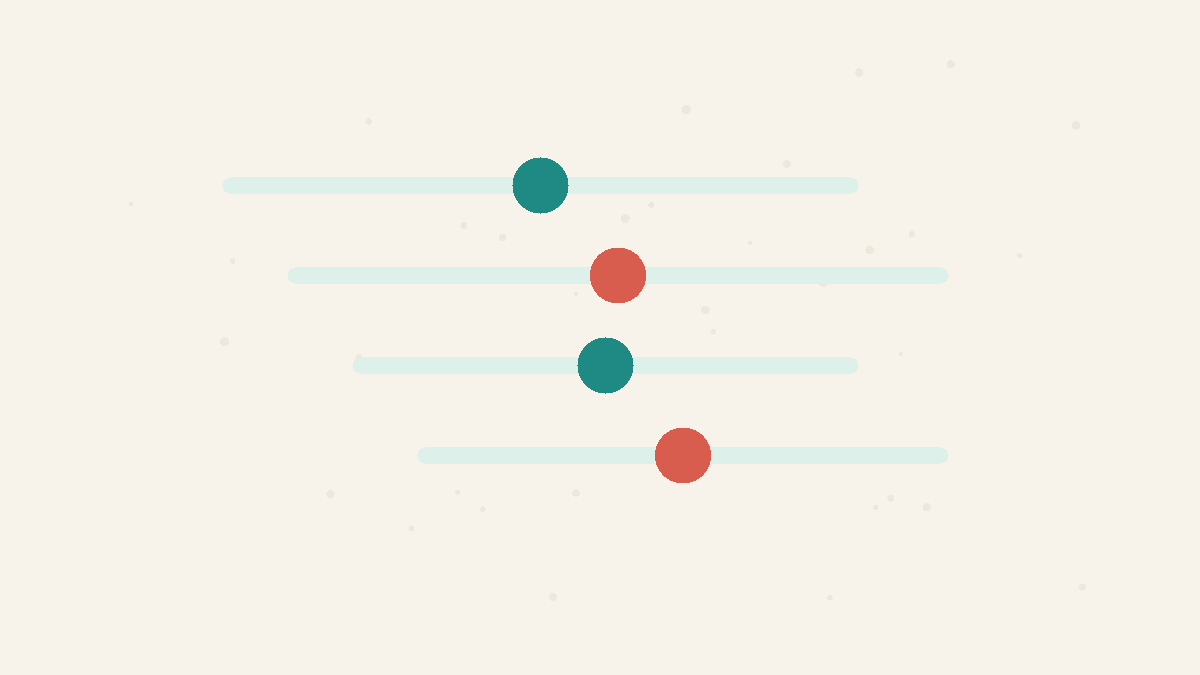
Uncertainty Needs Ranges
A measured number is usually a best estimate with sampling wobble around it, so honest comparisons need ranges as well as point estimates.