Glossary term
Quartile
One of the three cut points that split sorted data into four equal-sized groups.
Visual intuition
sort first
2
4
middle seat
100
Median = the value in the middle position
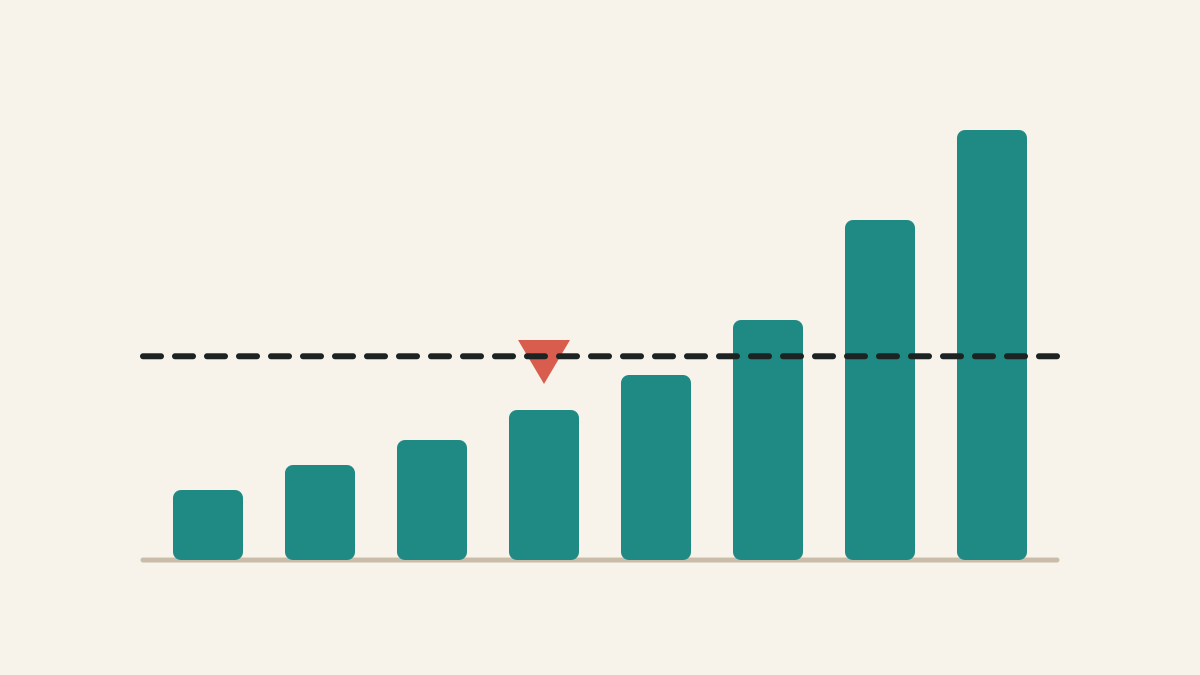
Quartiles are cut points in the sorted line: a quarter, half, and three-quarters of the way along — the middle one is the median.
Example
For the nine sorted values 2, 3, 5, 6, 8, 10, 12, 15, 20, the quartiles are Q1 = 4, = 8, and Q3 = 13.5, so the middle half spans 4 to 13.5.
How It Works
Sort the data and cut it into quarters: the first quartile (Q1) has 25% of values below it, the second is the , and the third (Q3) has 75% below. The middle half of the data lives between Q1 and Q3 — a span called the interquartile range — which makes quartiles a compact, -resistant way to describe both center and spread. Box plots are drawn from exactly these numbers.