Glossary term
Central Limit Theorem
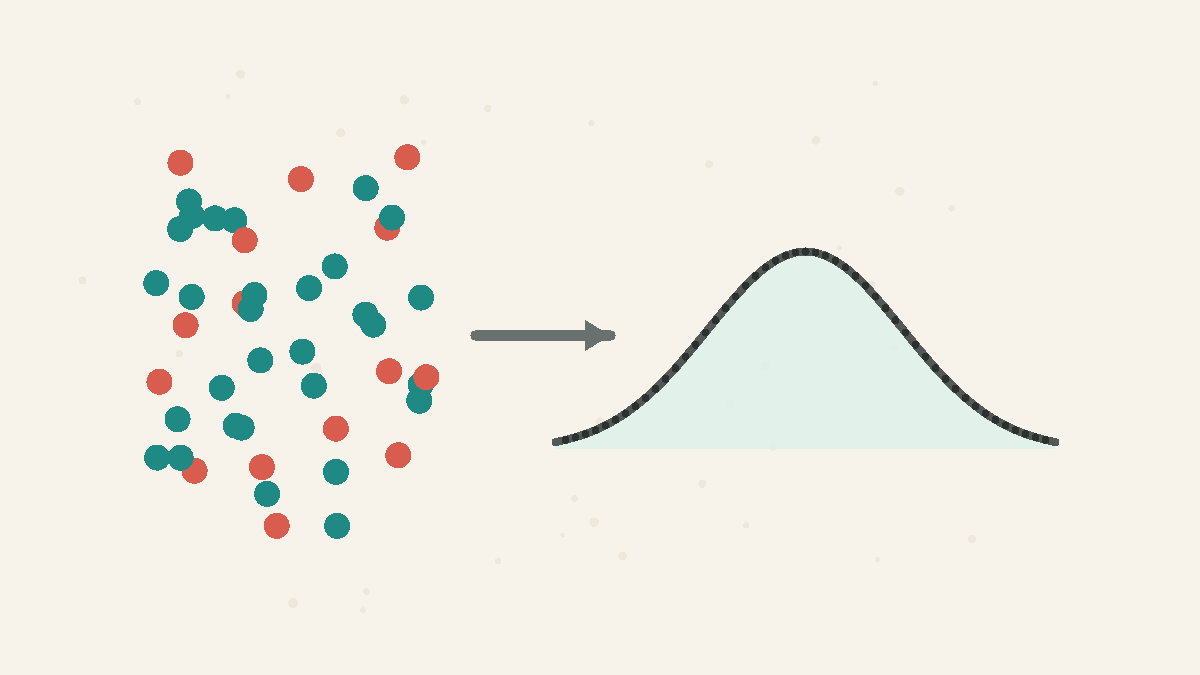
The result that averages of many independent values follow a normal, bell-shaped distribution — almost regardless of the shape of the raw data.
Visual intuition
n=4
n=16
n=64
Averages don't just tighten — they pile up in a bell
Each dot is one sample's average, clustering symmetrically around the truth and tighter as n grows. The central limit theorem adds the shape claim this sketch can only hint at: pile up enough of those averages and their histogram turns bell-shaped, whatever the raw data looked like.
Example
A single die roll is flat — each face has 1/6 — but the of 100 rolls piles up in a tight bell around 3.5, and an average near 6 becomes essentially impossible.
How It Works
Incomes are lopsided, dice are flat, coin flips are two spikes — yet enough of any of them and the averages themselves pile up in the same bell shape. That is the central limit theorem: sums and averages of many independent values become approximately normal, almost no matter what the ingredients look like. It is why the appears wherever many small influences add up — measurement errors, heights, means — and it is the licence behind most confidence intervals and p-values, which assume the average they are built on is roughly normal. The guarantee is about averages, not raw data: averaging never turns the incomes themselves bell-shaped, only their means.
Concepts
Central Limit Theorem
The central limit theorem says that averages of many independent, similar-sized random influences tend to form a bell-shaped sampling distribution, even when the original data are not bell-shaped. It explains why averages are often more predictable than individual observations.
Standard Error
Standard error is the typical sampling wobble of an estimate such as a mean. For independent observations, the standard error of a mean shrinks with the square root of the sample size, so cutting the error in half usually takes four times as much data.
Related Facts
Probability
4 min · medium
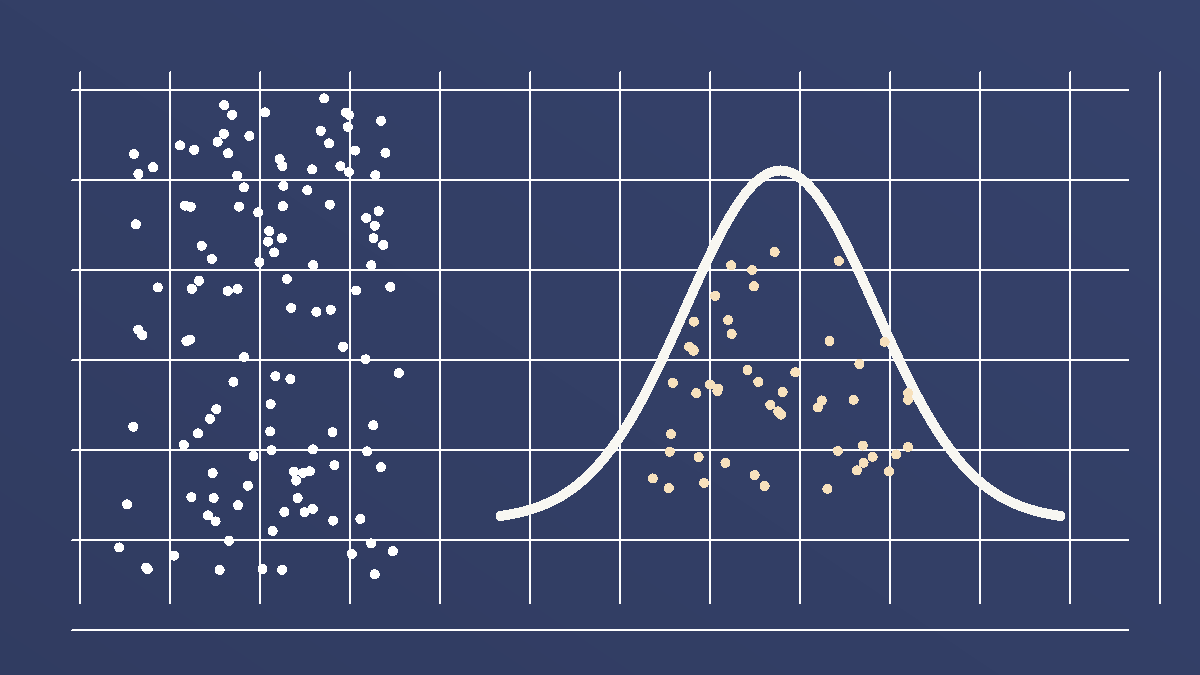
The central limit theorem makes averages look normal
Individual data can be skewed or messy, while averages of many independent observations often form a neat bell-shaped pattern.
Data Tricks
4 min · easy
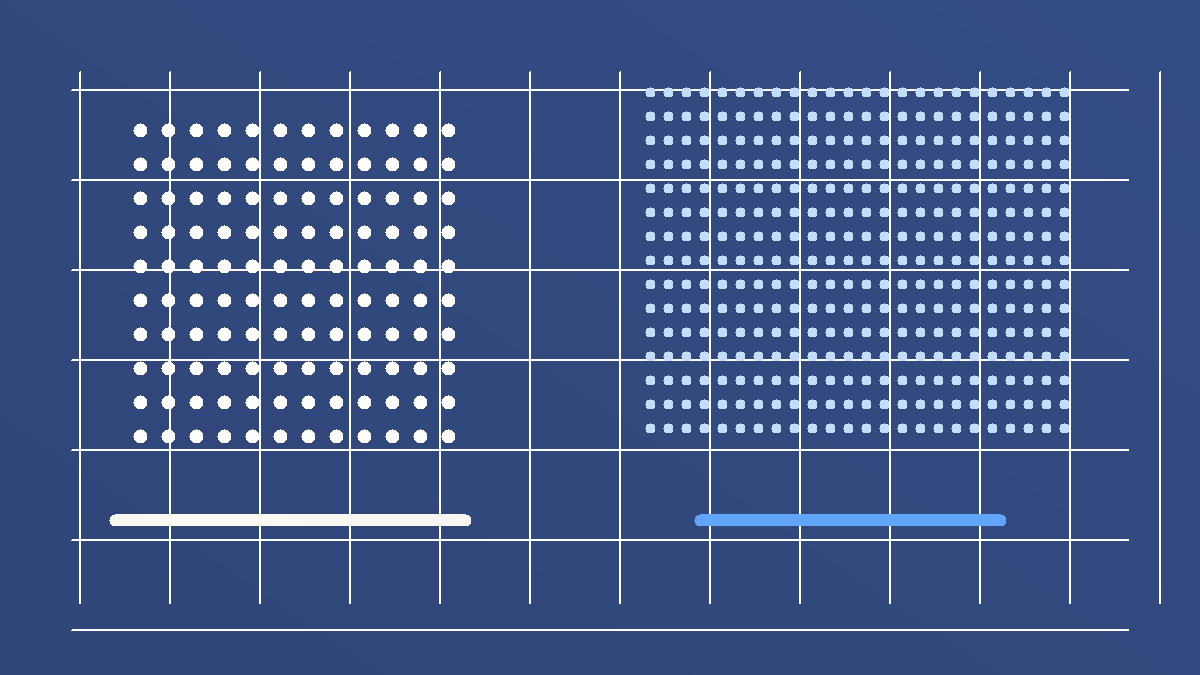
Twice as much data does not make estimates twice as precise
For many averages, cutting random error in half takes about four times as many observations. Precision has square-root returns.