Glossary term
Regression
A method that fits a line through data to describe how one variable changes with another and to make predictions.
Visual intuition
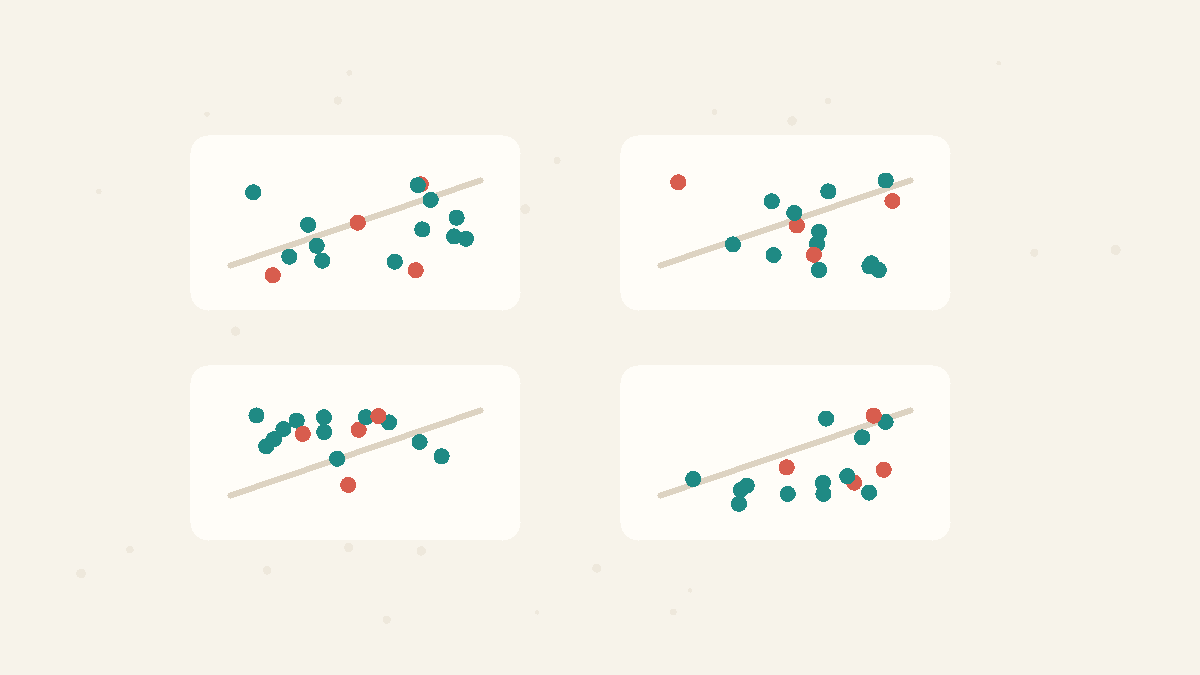
Regression picks the line that misses the dots least
The dots are size-vs-rent pairs and the dashed line is the regression: the one straight summary that misses the dots least, used to predict one variable from the other.
Formula
y ≈ intercept + slope * x
Example
If a rent regression for an illustrative city gives rent ≈ 200 + 14 × (square meters), a 60 m² flat is predicted at about 1,040 per month.
How It Works
Scatter apartment sizes against rents and the dots form a drifting cloud. Regression draws the best-fitting line through it — chosen so the dots' misses stay as small as possible — giving you a slope you can read as a rate: roughly how many euros each extra square meter costs. It summarizes trends and predicts new cases, but the line only describes association; fitting it does not prove that x causes y. (The name also appears in 'regression to the ' — a related but distinct idea.)
Concepts
Correlation vs Causation
Two things moving together does not mean one causes the other. A third variable (a confounder) can drive both, or the link can be coincidence. Establishing causation needs more than correlation — usually a controlled comparison.
Regression to the Mean
An extreme measurement is usually a mix of a stable, repeatable part and a one-off lucky part. Because the lucky part rarely shows up the same way twice, the next measurement of the same thing tends to land closer to the average. This is not a force that pulls things toward the middle. It is simply what selecting on luck looks like once you measure again.
Related Facts
Data Tricks
4 min · easy
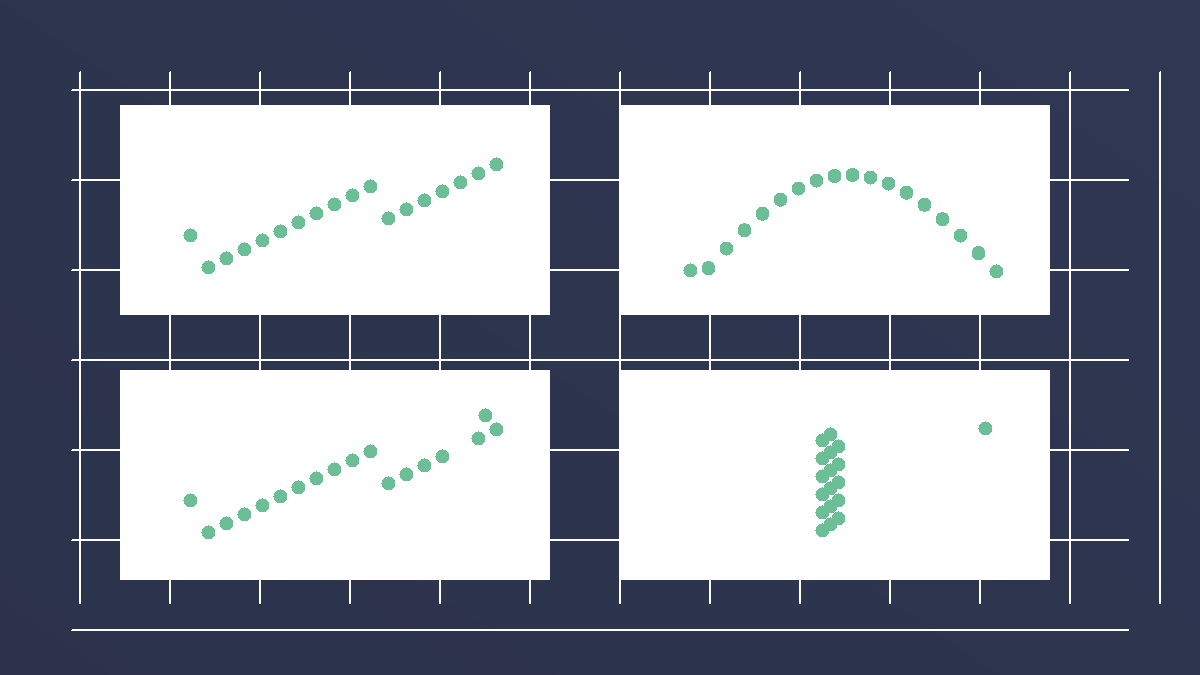
Anscombe's quartet has the same statistics and different stories
Four datasets can share almost the same mean, variance, correlation, and regression line, yet look completely different when plotted.
Data Tricks
5 min · easy
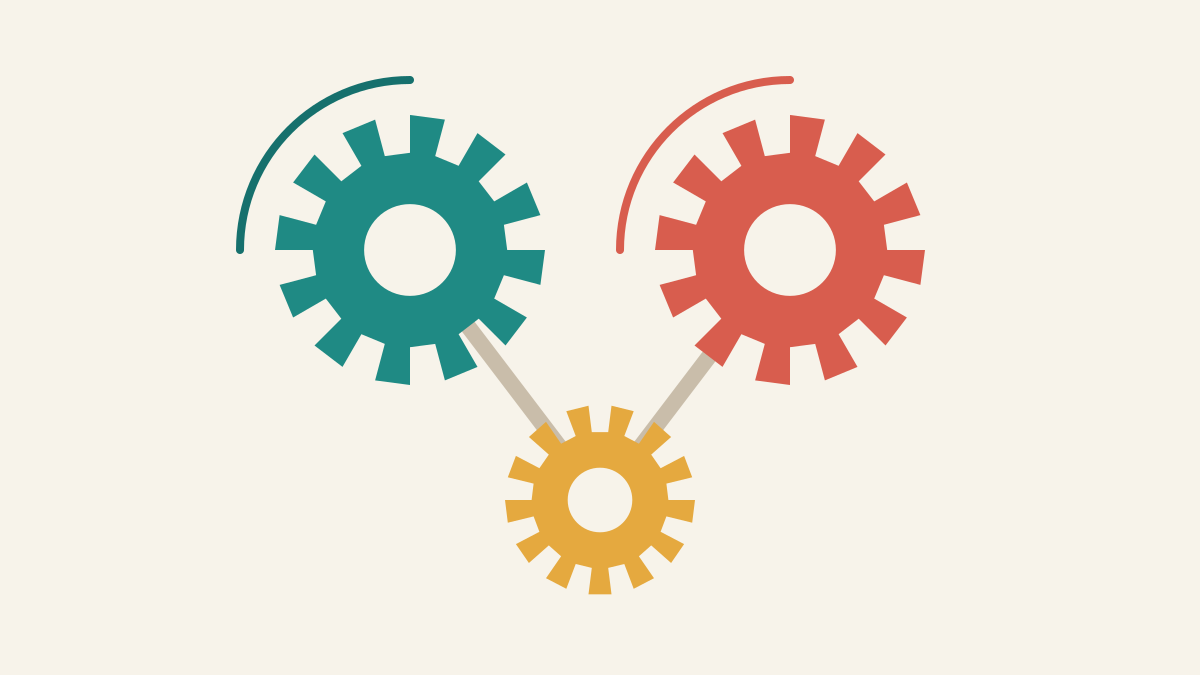
Correlation vs causation: why moving together is not proof
Correlation says two things move together. Causation says one changes the other. A hidden third factor can make correlation look causal.
Paradoxes
4 min · medium

The best performers usually slip next time
A team's top scorers, a test's top students, and a clinic's sickest patients all tend toward the middle on the next measurement with no intervention at all, because the extreme result was part skill and part luck, and the luck rarely repeats.