Glossary term
Distribution
The overall pattern of where values land — which values occur, and how often each one does.
Visual intuition
30
31
32
33
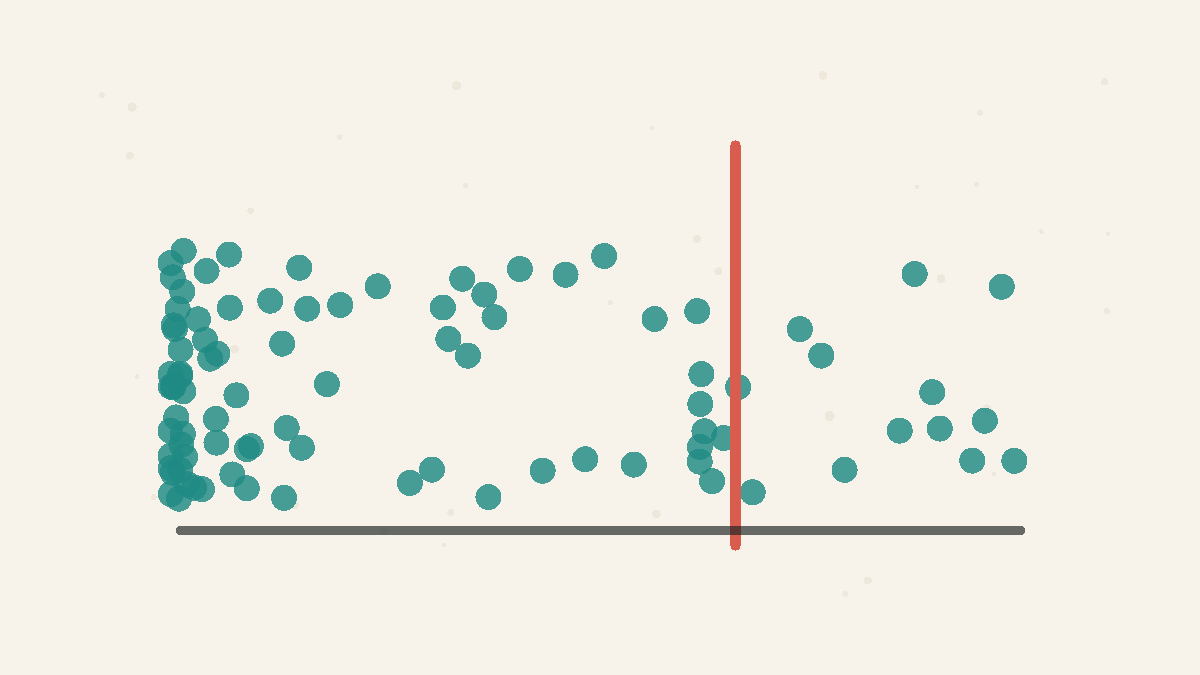
most values
mean pulled right
300
One extreme value can drag summaries away from the cluster
A distribution is the whole shape of the data: the tight cluster and the far-out straggler both belong to it.
Example
In an illustrative town, most commutes cluster around 20-30 minutes while a few exceed 90 — a right-skewed distribution, so the commute is longer than the typical one.
How It Works
Write down every commute in town: lots near 25 minutes, fewer near 50, a stubborn few past 90. That whole pattern — the pile-up, the spread, the tail — is the distribution. Summary numbers like the compress it to a single point, and two very different distributions can share the same mean, which is why looking at the shape often changes the conclusion.
Concepts
Summary Statistics
Summary statistics compress a dataset into numbers such as the mean, variance, correlation, or regression line. They are useful, but they can hide shape, outliers, clusters, and curved relationships that a graph would reveal immediately.
Averages Mislead
The mean adds everything up and divides, so a few extreme values can drag it far from the typical case. In skewed data the median — the middle value — better represents what is normal. Ask about the shape of the data, not just its average.
Lessons
Averages Hide the Shape
A single number cannot capture a lopsided distribution.
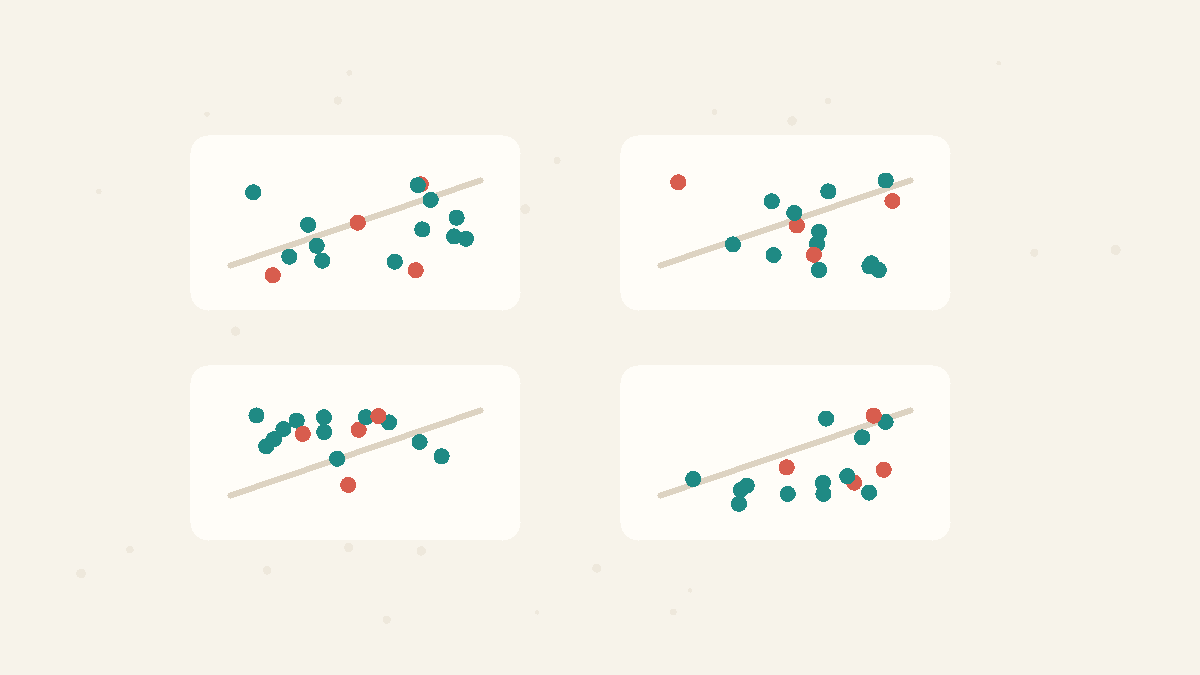
Summaries Need Pictures
Means, variances, correlations, and regression lines can match while the underlying data tell completely different stories.
Related Facts
Data Tricks
5 min · easy
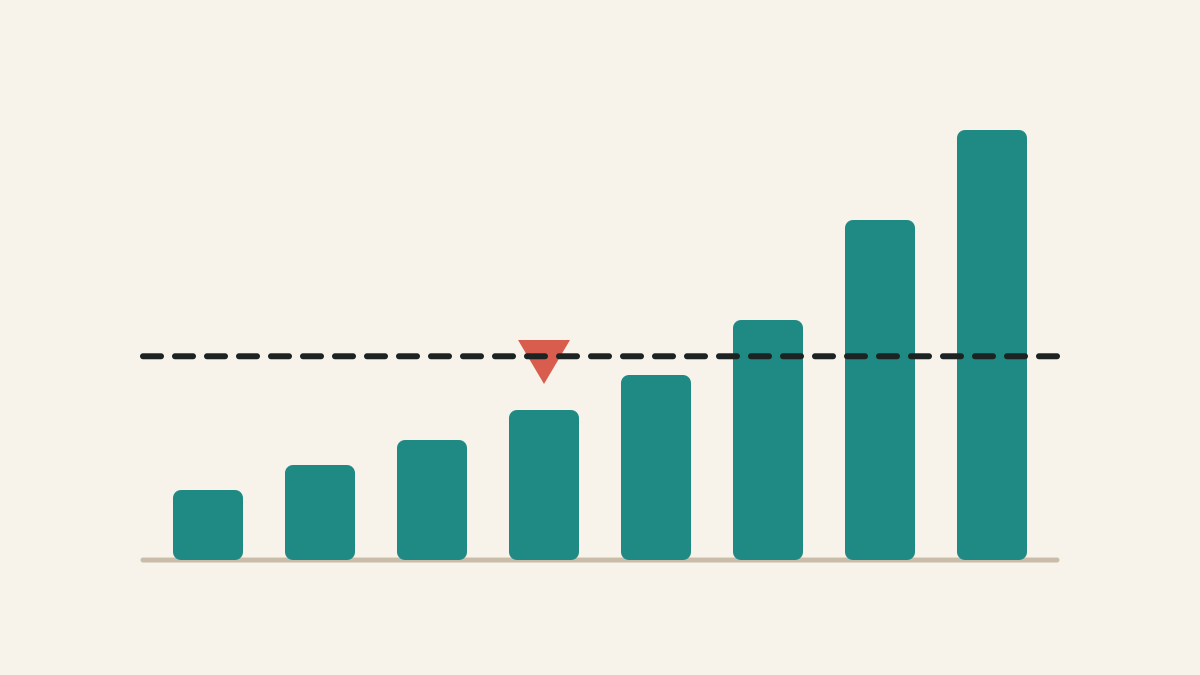
Mean vs median: which average should you use?
The mean shares the total equally. The median finds the middle case. In skewed data, those can tell very different stories.
Data Tricks
4 min · easy
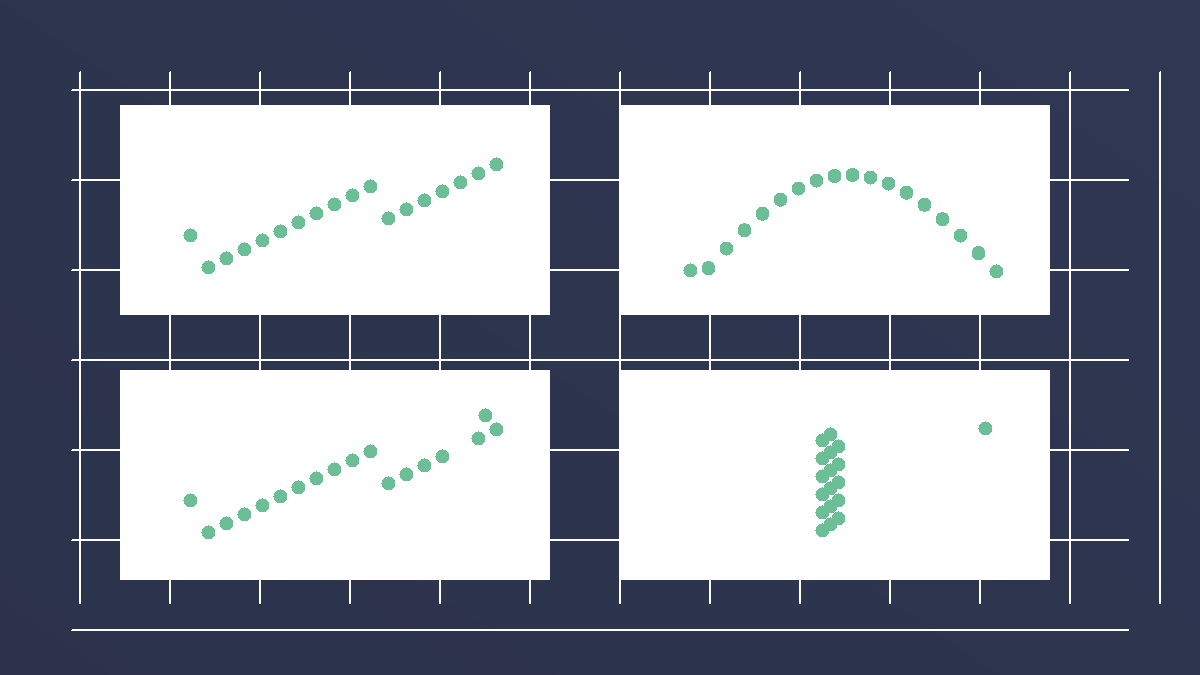
Anscombe's quartet has the same statistics and different stories
Four datasets can share almost the same mean, variance, correlation, and regression line, yet look completely different when plotted.