Collection
Statistics Comparisons Explained
Clear side-by-side explanations for the statistical terms people most often mix up.
Comparison searches are usually urgent: someone has seen two statistical terms in the same article, table, dashboard, or study and needs to know whether they mean the same thing. They usually do not. A p-value is not a confidence interval, a mean is not a median, and correlation is not causation. This collection gathers the highest-value side-by-side explanations in one place.
Use these pages when a definition alone is too thin. Each comparison explains what each term answers, the mistake that makes the pair confusing, and the situation where one term is safer than the other. What you get is better decisions, not vocabulary trivia: knowing which number describes scale, which describes uncertainty, and which only gives a clue.
Start with the pair that appears in front of you. If you are reading a study, begin with p-value vs confidence interval or standard error vs standard deviation. If you are reading a headline, begin with relative risk vs absolute risk or correlation vs causation. If you are reading income, prices, waiting times, or skewed data, begin with mean vs median.
Pick the pair that matches the claim
A study table usually calls for p-values, confidence intervals, standard errors, and standard deviations. A headline usually calls for risk framing or causation checks. A skewed dataset usually calls for mean and median. Starting with the right pair keeps the question narrow enough to answer clearly.
Read the table before the story
Each comparison page includes a compact table: what each term answers, what people get wrong, and when to use it. Read that table first. Then use the worked example and interactive piece to test whether the distinction changes how you interpret the original claim.
Use comparisons as internal checks
The pairs reinforce one another. Confidence intervals and standard errors both describe uncertainty. Relative risk and correlation both sound stronger than they may be without context. Mean and median remind you that a single summary can hide shape. Moving between the pages builds a practical checklist for reading numbers.
Featured Facts
Data Tricks
5 min · medium
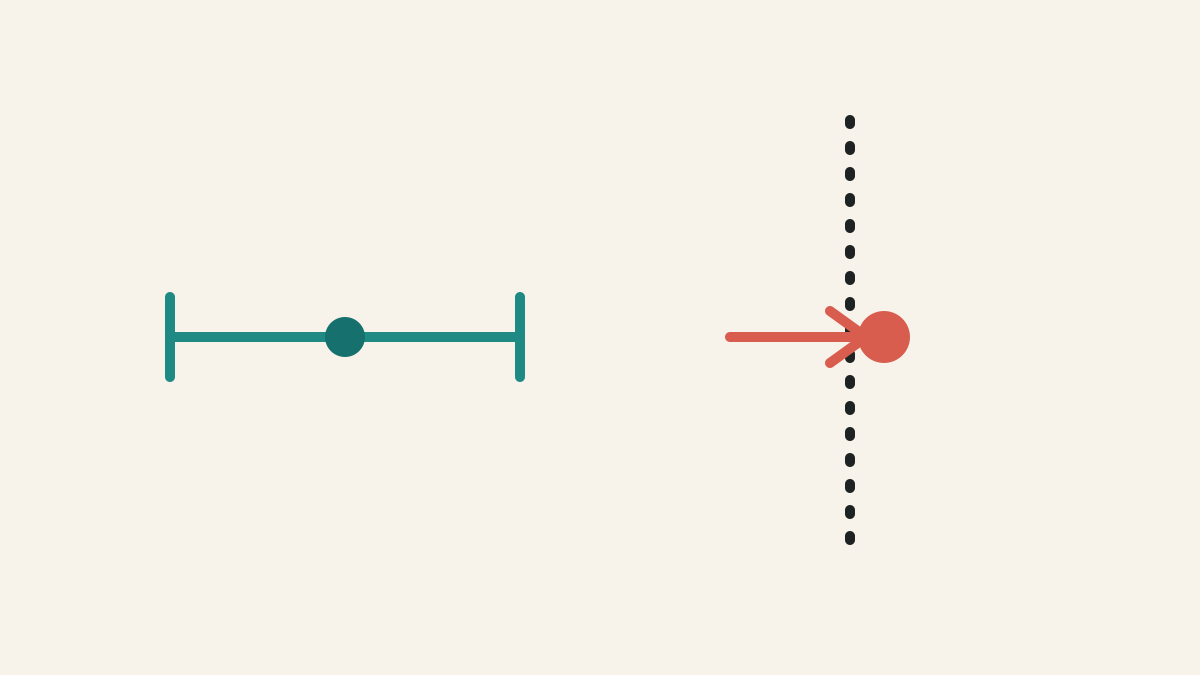
P-value vs confidence interval: what each one tells you
A p-value asks whether the data look surprising under a null model. A confidence interval asks which effect sizes remain plausible.
Data Tricks
5 min · easy
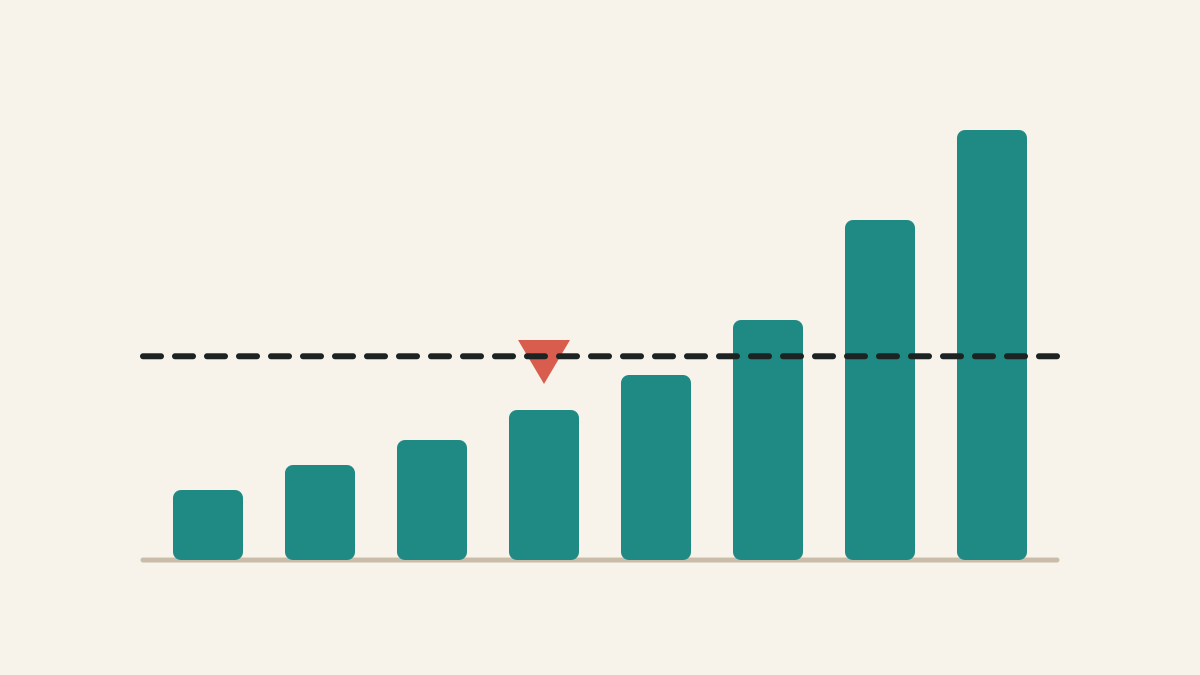
Mean vs median: which average should you use?
The mean shares the total equally. The median finds the middle case. In skewed data, those can tell very different stories.
Risk & Decisions
5 min · medium
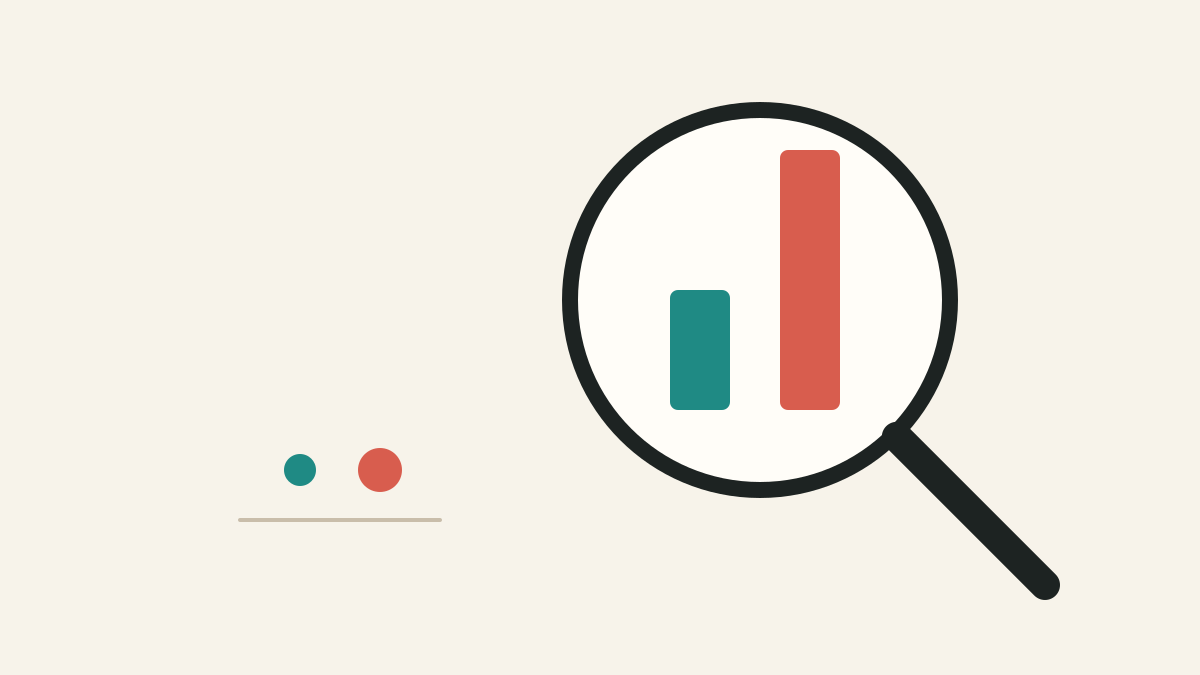
Relative risk vs absolute risk: the difference that changes decisions
Relative risk tells you how many times bigger a risk became. Absolute risk tells you how many extra people are affected.
Data Tricks
5 min · easy

Correlation vs causation: why moving together is not proof
Correlation says two things move together. Causation says one changes the other. A hidden third factor can make correlation look causal.
Data Tricks
5 min · easy
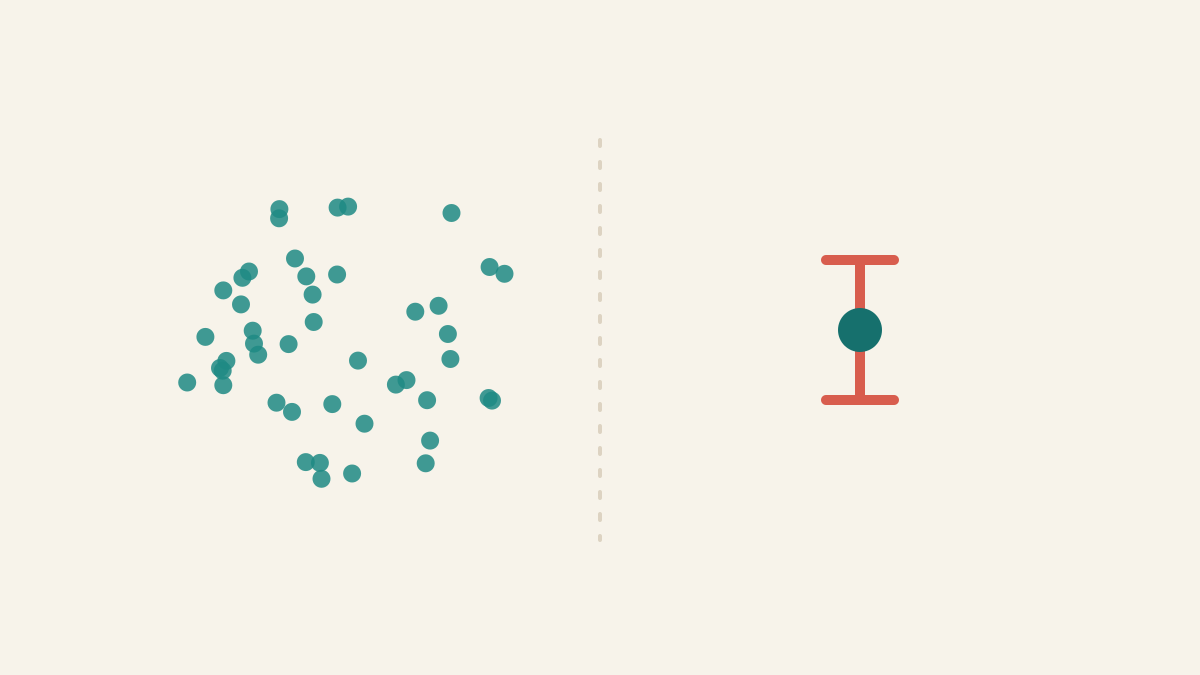
Standard error vs standard deviation: spread vs precision
Standard deviation describes spread among individual values. Standard error describes uncertainty in an estimate such as the mean.
Lessons
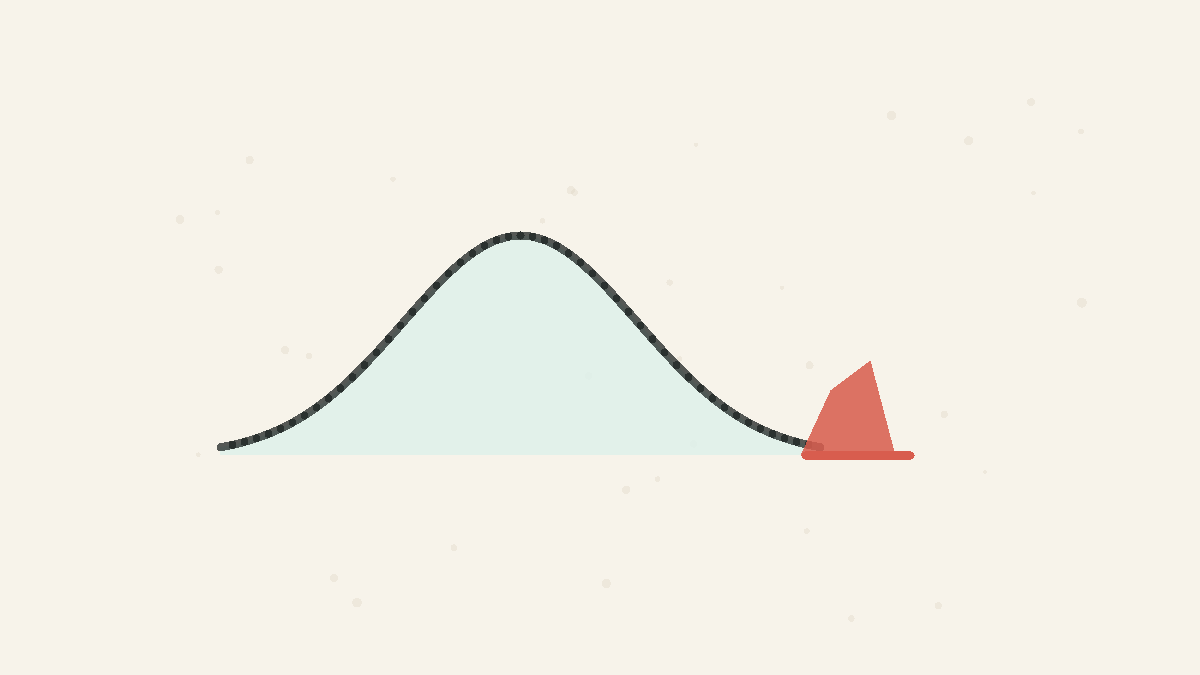
Small P Is Not Proof
A small p-value says the data would be surprising under a null model, not that the claim is probably true or important.
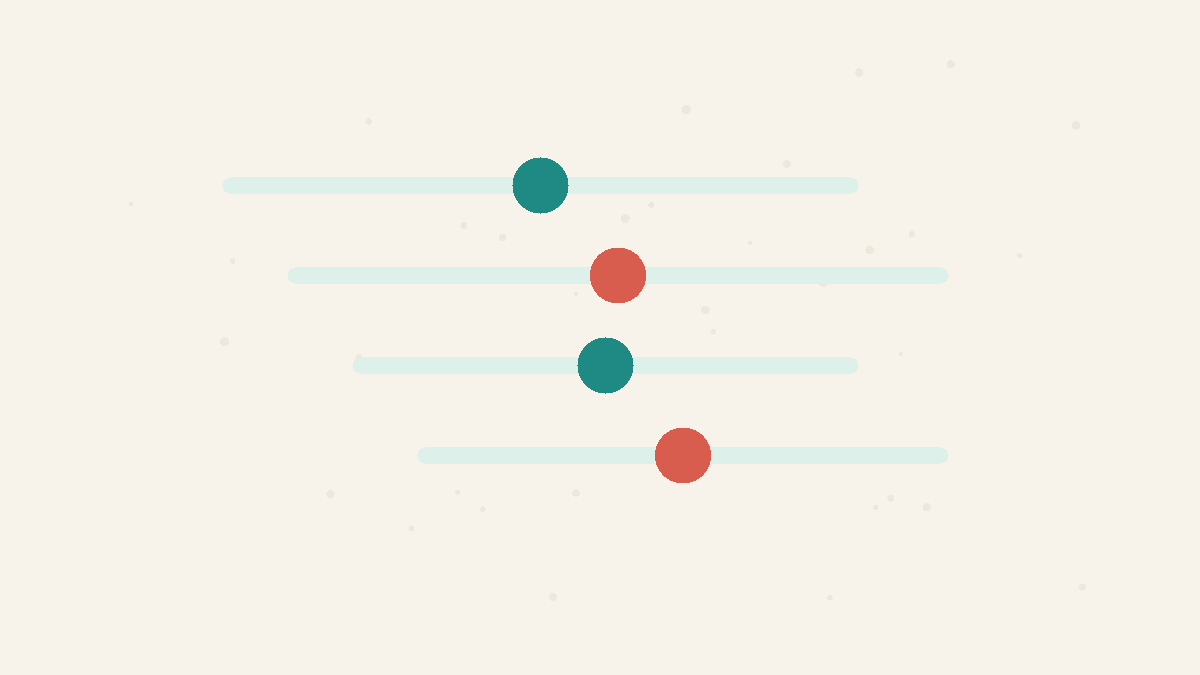
Uncertainty Needs Ranges
A measured number is usually a best estimate with sampling wobble around it, so honest comparisons need ranges as well as point estimates.
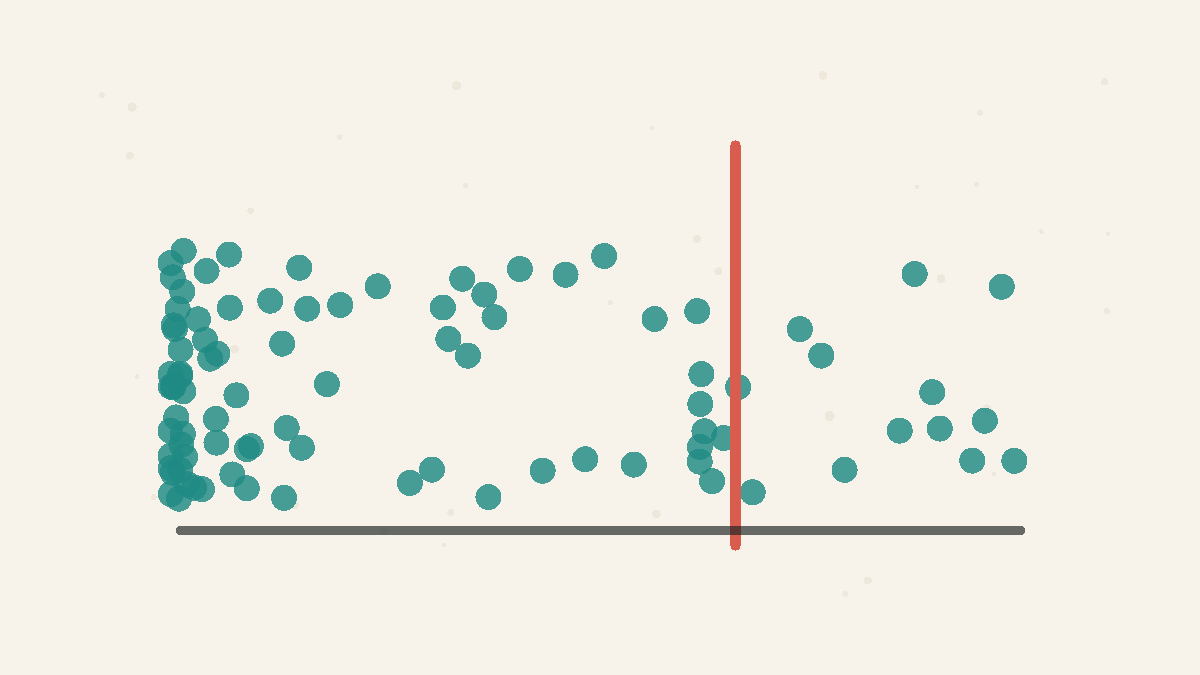
Averages Hide the Shape
A single number cannot capture a lopsided distribution.
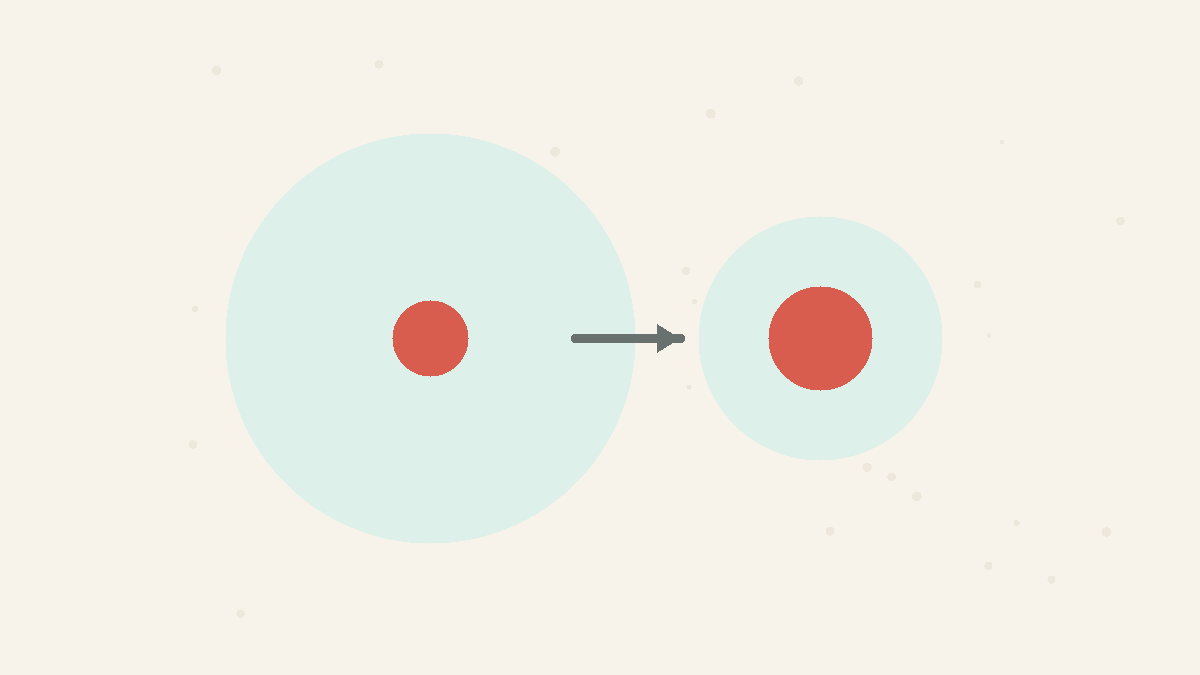
Ask for the Absolute Number
A percentage change is meaningless without the base it changes.
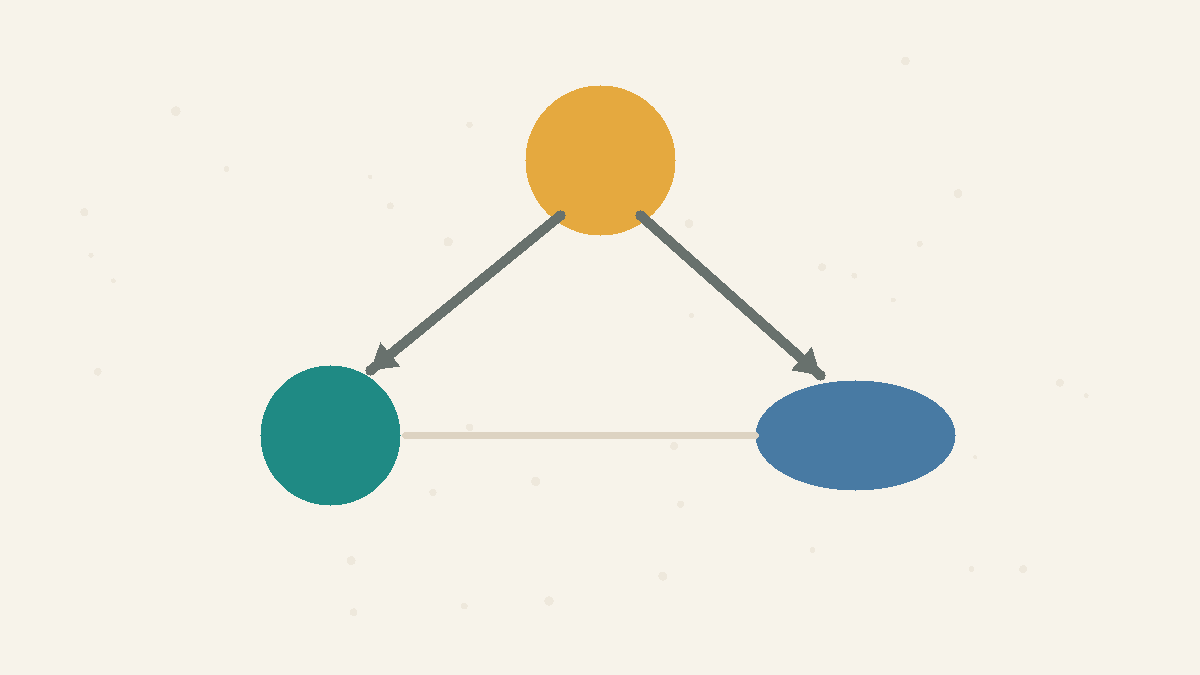
Shared Causes Fake Links
A hidden common cause can make unrelated things move together.
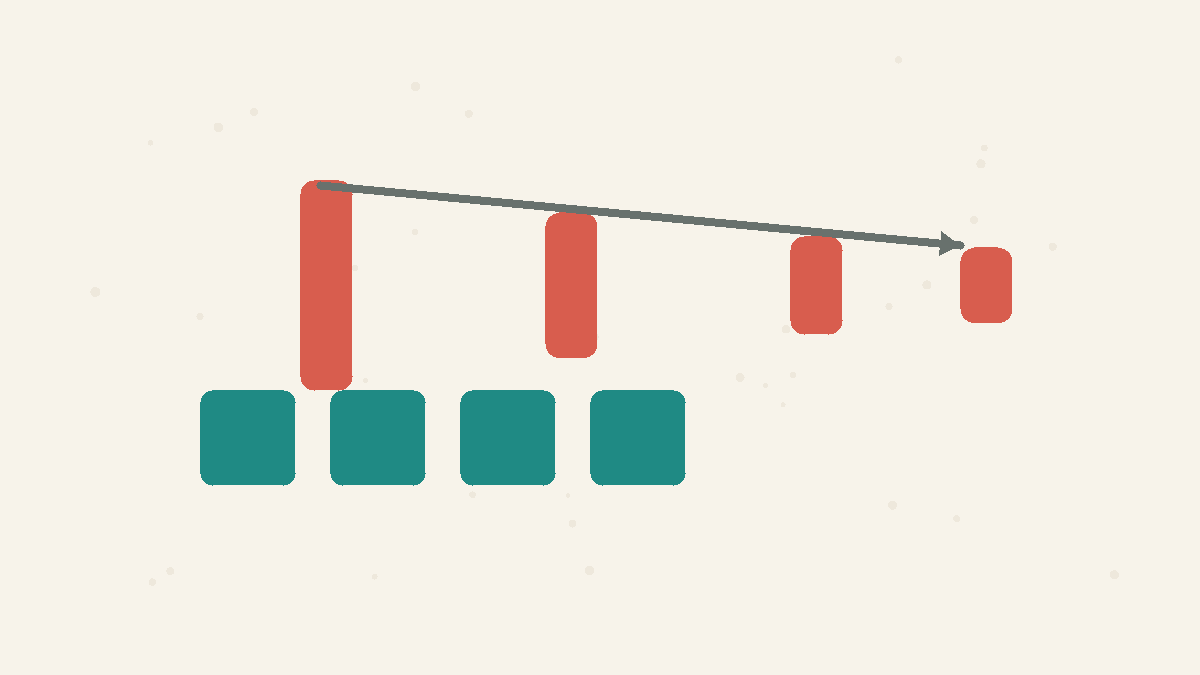
Precision Has Square-Root Returns
More data helps, but random error shrinks slowly: to halve the noise in an average, you usually need four times as many observations.
Concepts
P-Values
A p-value is the probability of seeing data at least this extreme if a specific null model were true. It is not the probability that the claim is false, not the chance the result was random, and not a measure of how large or important the effect is.
Confidence Intervals
A confidence interval is a range produced by a method that captures the true value a stated share of the time across repeated samples. It describes uncertainty in the estimating method, not a personal guarantee that one already-computed interval contains the truth.
Averages Mislead
The mean adds everything up and divides, so a few extreme values can drag it far from the typical case. In skewed data the median — the middle value — better represents what is normal. Ask about the shape of the data, not just its average.
Absolute vs Relative Risk
A relative change ('50% more', 'doubles your risk') hides how big the underlying risk actually is. A large relative increase on a tiny base rate is still tiny. Always ask for the absolute numbers — how many in 100 before and after — not just the percentage change.
Correlation vs Causation
Two things moving together does not mean one causes the other. A third variable (a confounder) can drive both, or the link can be coincidence. Establishing causation needs more than correlation — usually a controlled comparison.
Standard Error
Standard error is the typical sampling wobble of an estimate such as a mean. For independent observations, the standard error of a mean shrinks with the square root of the sample size, so cutting the error in half usually takes four times as much data.
Standard Deviation
Standard deviation describes how spread out individual observations are around their mean. It is about variation in the data itself. Standard error is different: it describes how much an estimate such as the sample mean would vary across repeated samples.
Uncertainty
The honest range left after measurement limits, model choices, and missing information. A single number can be useful as a midpoint, but decisions usually need plausible low and high values too. Good estimates state the assumptions that would move the answer.