Collection
Sampling and Averages
What averages can and cannot tell you, and why sample size changes everything.
A single product review can say anything. A hundred reviews start to mean something. That shift from one noisy number to a stable average is where most practical statistics lives, and every page in this collection works on some part of it.
The mechanics come first. Galton's fair-goers guessed an ox's weight better together than any expert alone, and averages of almost any messy data settle into the same bell shape as samples grow. Precision obeys a stubborn square-root rule, though: to halve the error, you need four times the data.
Then come the traps. Small samples swing hard enough to crown false winners. Extreme results drift back toward normal on the next measurement, which is how coaches and speed cameras collect credit they did not earn. And when data is skewed, the mean and the median stop agreeing, so the first question about any average is which one you were given.
If you make decisions from dashboards or reviews, these pages tell you how much noise to expect for a given sample size. That is usually enough to stop a bad call.
Noise shrinks slowly
Doubling your data does not halve your error; quadrupling it does. That square-root arithmetic explains why polls stall near a thousand respondents and why the last decimal place of precision is always the most expensive one. Budget for it before the study, not after.
Extremes drift back
Pick anything because it was extreme, a record quarter or a worst-in-class error rate, and its next measurement will usually sit closer to average with no intervention at all. Regression to the mean is the explanation to rule out before crediting a fix, a coach, or a policy.
Which average were you given?
A street where nine houses sell near 250,000 and one sells for 2 million has a mean price above 400,000 that describes no actual house. Skew pulls the mean away from the median, and most money data is skewed. When a report says "average", finding out which one is half the analysis.
Featured Facts
Psychology of Numbers
4 min · easy

A fairground crowd guessed an ox's weight almost perfectly
At a 1906 country fair, the median of hundreds of independent guesses of an ox's weight came within about 1% of the truth — beating almost every individual guesser.
Probability
4 min · medium
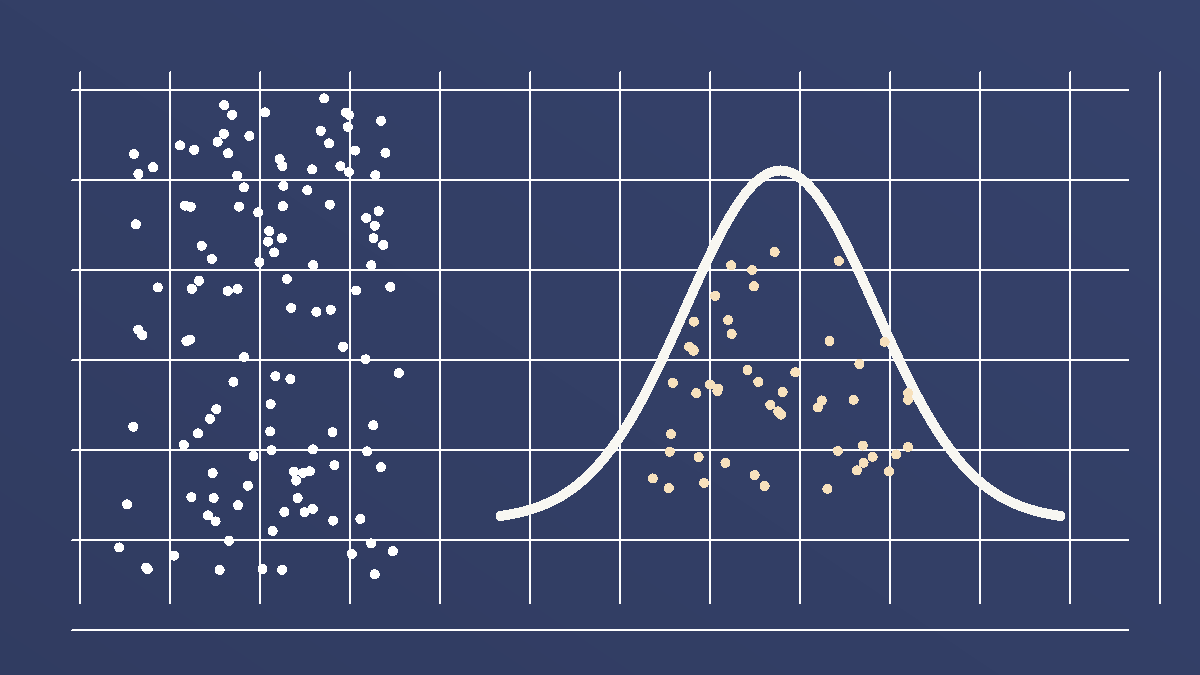
The central limit theorem makes averages look normal
Individual data can be skewed or messy, while averages of many independent observations often form a neat bell-shaped pattern.
Data Tricks
4 min · easy
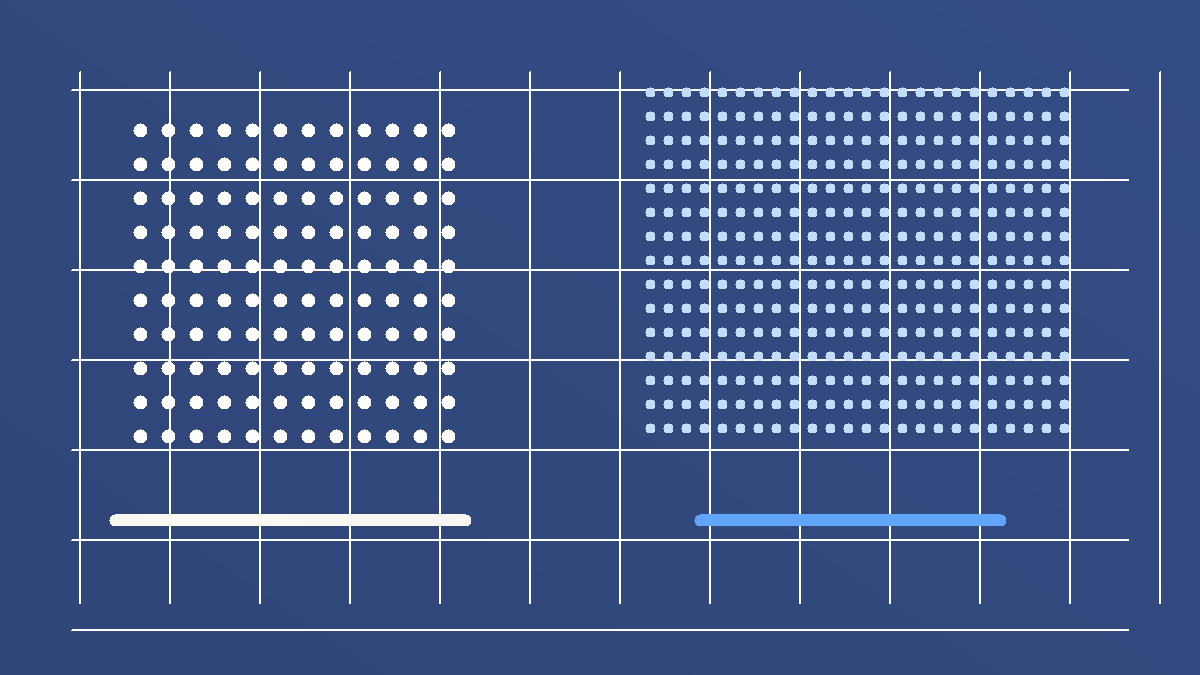
Twice as much data does not make estimates twice as precise
For many averages, cutting random error in half takes about four times as many observations. Precision has square-root returns.
Paradoxes
4 min · medium

The best performers usually slip next time
A team's top scorers, a test's top students, and a clinic's sickest patients all tend toward the middle on the next measurement with no intervention at all, because the extreme result was part skill and part luck, and the luck rarely repeats.
Data Tricks
4 min · medium

The smallest towns top both the best and worst lists
Rank places by any rate — cancer, test scores, crime — and the extremes are dominated by the smallest places, because small samples swing far from the true rate by luck alone.
Data Tricks
5 min · easy
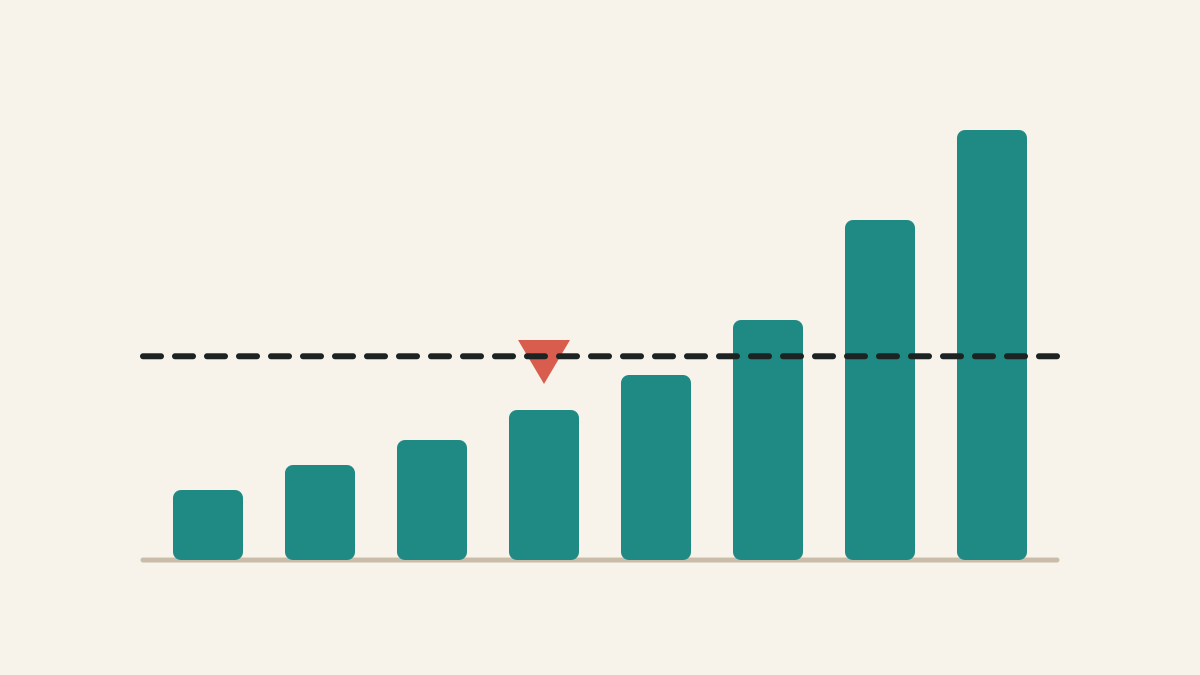
Mean vs median: which average should you use?
The mean shares the total equally. The median finds the middle case. In skewed data, those can tell very different stories.
Lessons
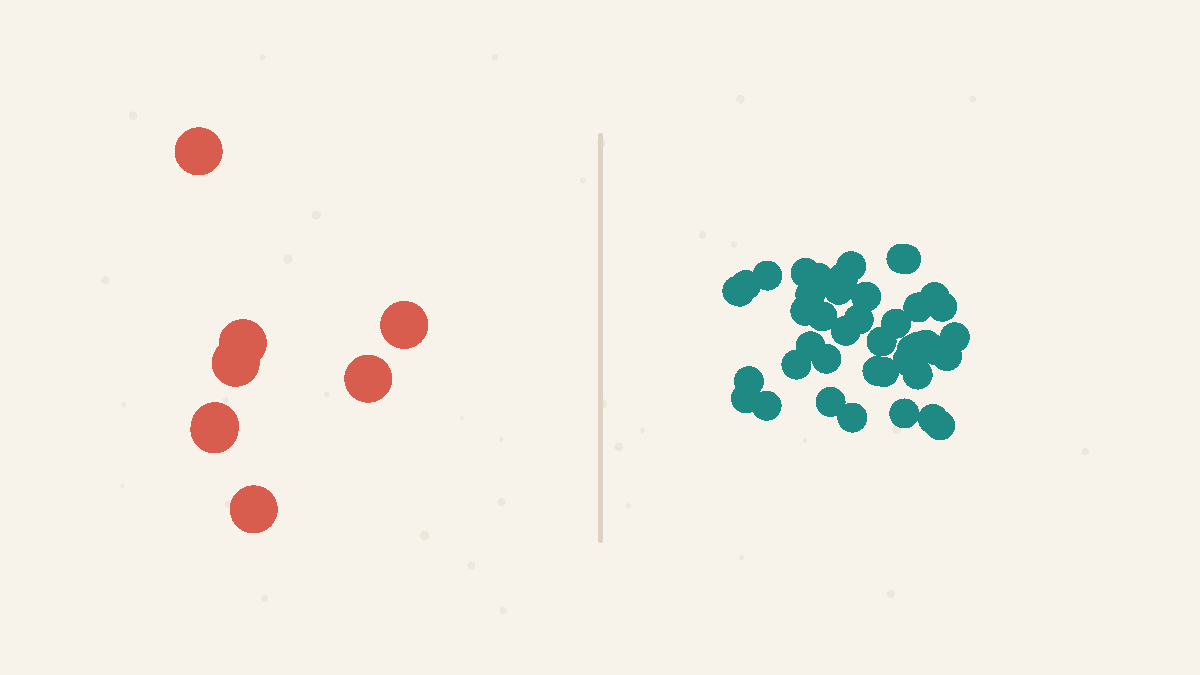
Small Samples Are Noisy
A small sample can land far from the truth by luck alone, while a larger one averages that luck away. This lesson shows how spread shrinks with the square root of the sample size and why the smallest groups dominate the extremes of any ranking.
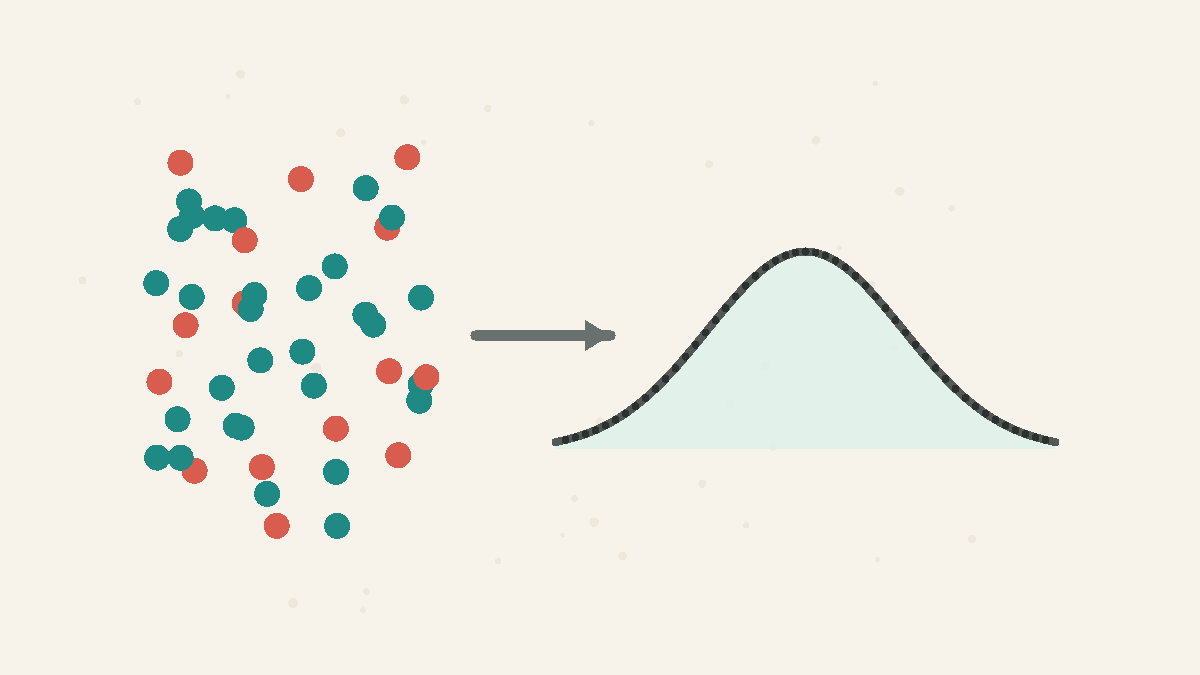
Averages Stabilize in Shape
Individual observations can be messy, skewed, or spiky, yet averages of many independent observations often settle into a predictable bell-shaped pattern.
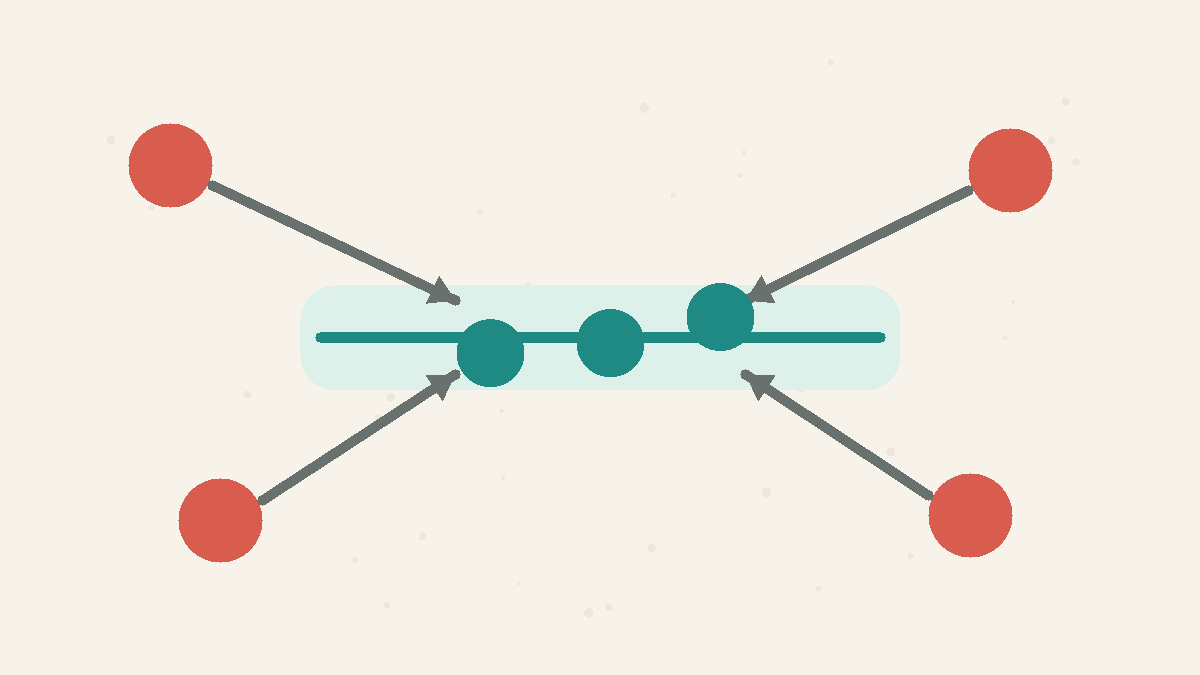
Extremes Drift Back to Average
Record-setting and rock-bottom results usually move toward the average next time, with no cause behind it.
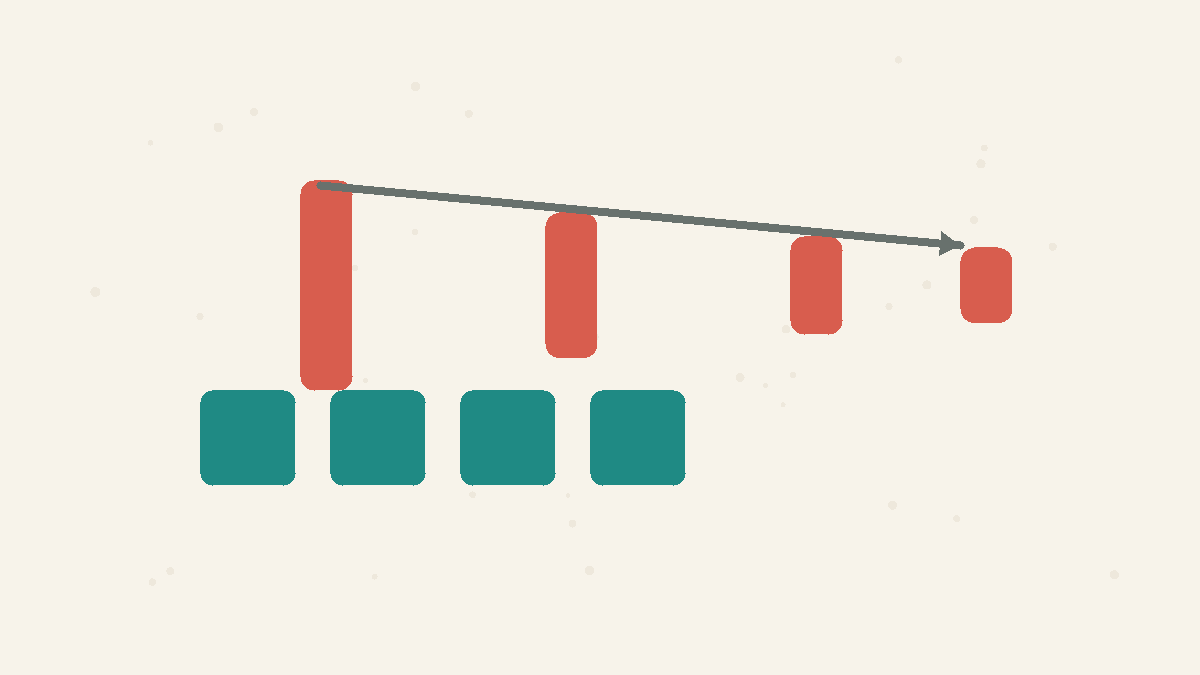
Precision Has Square-Root Returns
More data helps, but random error shrinks slowly: to halve the noise in an average, you usually need four times as many observations.
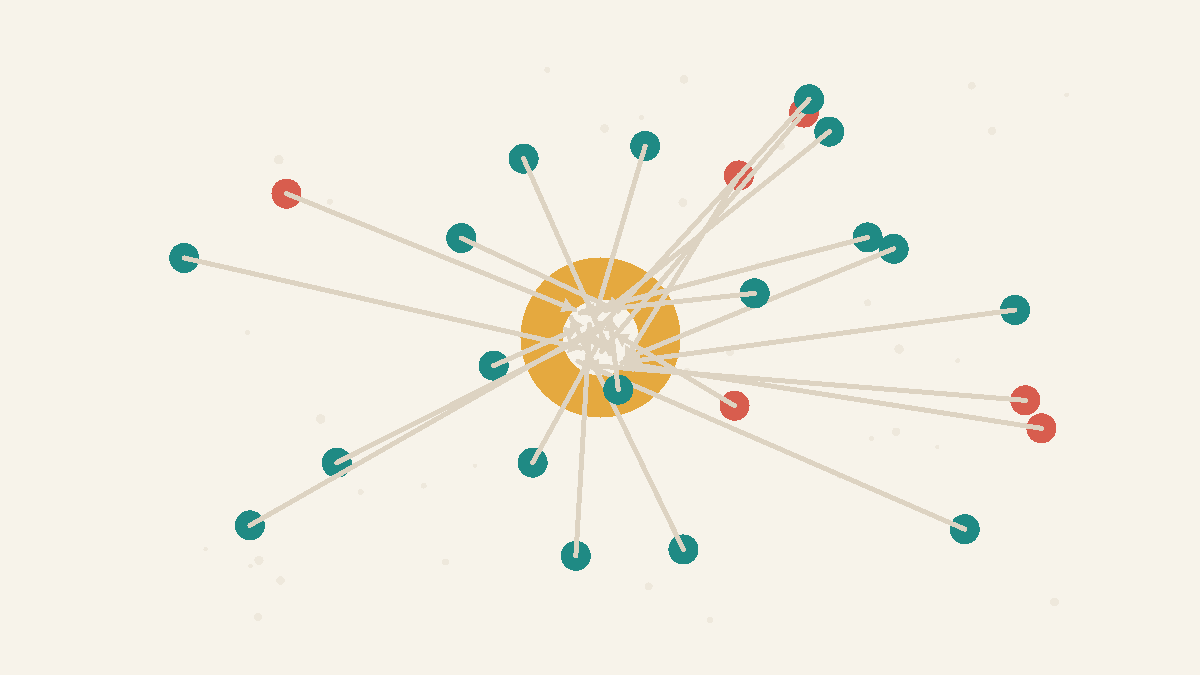
Independent Errors Cancel
Average many independent guesses and their random errors offset, leaving an estimate closer to the truth than most individuals.
Concepts
Law of Large Numbers
As a sample grows, its average gets closer to the true average and random swings shrink, roughly in proportion to 1 over the square root of the sample size. Small samples can land far from the truth purely by chance, which is why a handful of observations is so easy to misread.
Central Limit Theorem
The central limit theorem says that averages of many independent, similar-sized random influences tend to form a bell-shaped sampling distribution, even when the original data are not bell-shaped. It explains why averages are often more predictable than individual observations.
Regression to the Mean
An extreme measurement is usually a mix of a stable, repeatable part and a one-off lucky part. Because the lucky part rarely shows up the same way twice, the next measurement of the same thing tends to land closer to the average. This is not a force that pulls things toward the middle. It is simply what selecting on luck looks like once you measure again.
Standard Error
Standard error is the typical sampling wobble of an estimate such as a mean. For independent observations, the standard error of a mean shrinks with the square root of the sample size, so cutting the error in half usually takes four times as much data.
Averages Mislead
The mean adds everything up and divides, so a few extreme values can drag it far from the typical case. In skewed data the median — the middle value — better represents what is normal. Ask about the shape of the data, not just its average.
Summary Statistics
Summary statistics compress a dataset into numbers such as the mean, variance, correlation, or regression line. They are useful, but they can hide shape, outliers, clusters, and curved relationships that a graph would reveal immediately.